Decision Server Insights – Operational Monitoring
Introduction
In this document I will outline best-practices for monitoring and managing your ODM Decision Server Insights (DSI) solutions in production. I will present the product’s capabilities for software architects and engineers working in operations support.
Note that the focus of this document is on monitoring for operations support, not business KPI monitoring, such as typically implemented using IBM Business Monitor or similar tools.
Summary of Best Practices
- Understand your operational monitoring objectives and service level agreements
- Define DevOps processes to ensure deployment and configuration is reliable
- Aggregate your logs from all your servers: index and query using a web user interface
- Monitor key metrics to ensure your containers and solutions are performing well
- Create operational alerts and build dashboards to improve operational efficiency
Sample DSI Topology
An ODM DSI solution topology is composed of a set of inbound event routing servers, runtime servers for event processing, catalog servers that maintain the structure of the data/compute grid and outbound event dispatch servers. A highly available configuration is composed of (at minimum):
- 3 catalog servers
- 4 runtime servers (primary, sync replica, async replic, rolling upgrade server)
- 2 inbound servers
- 2 outbound servers
- HA database server
- HA external messaging servers, or IBM Information Bus (optional)

Detailed information on sizing and defining a DSI topology is out of scope for this article. Please refer to the product documentation for the latest recommendations.
In addition you will deploy Log Analytics Servers to aggregate the logs produced by the servers. These can be based on an external instance of IBM Log Analytics Server, the instance of SmartCloud Analytics Embedded that ships with DSI, the Open Source Logstash product, or other log aggregator.
ODM DSI exposes a broad range of operational metrics and operations via scripts and over JMX/REST. The most important of these are: JVM metrics related to heap utilization and garbage collection, inbound queue depth (indicates whether DSI is keeping up with the volume of incoming events), outbound queue depth, and statistics on how long each agent is taking to process different types of events. How to access the key metrics is described in more detail in the conclusions section.
First, Understand Your Objectives
To put in place a successful operational monitoring capability you need to understand your business objectives and have staffed your team and budgeted sufficient time, software and hardware budget to realistically be successful.
Too often I see operational monitoring “bolted on” to projects without sufficient planning and discussion up front. If you are building a business critical capability (and I hope you are!) then you should have a reasoned discussion with the business stakeholders about their availability requirements, and the costs associated with, for example, moving from 99.9% availability (down for 10 minutes per week) to 99.999% availability (down for 5 minutes per year).
Given the inevitability of hardware failures, to achieve very high levels of availability you will need very high levels of redundancy across your entire infrastructure: ISP, storage, networking, authentication services, messaging, database… Redundant hardware necessarily complicates software configuration as many tiers have to be able to seamlessly fail-over to backup systems.
Define the Team
You will want to start by making sure that within the organization it is well understood who is responsible for the operational monitoring of your new ODM Insights-based solution. Do they have enough time, training and resources to take on this additional responsibility?
Define Service Level Agreements
A key part of understanding your objectives is to discuss the service level agreements (SLAs) for the ODM Insights solution. These should be expressed in terms of availability, but also in terms of latency to detect a situation. Eg. the ODM Insights solution must be able to detect 99% of instances of customer situation X within 100 milliseconds, writing an outbound message to a queue when the situation occurs.
Disaster Recovery and Business Continuity
Define your objectives for disaster recovery. If necessary war game some scenarios and discuss how the organization as a whole should respond to:
- A fire in the primary data center: the entire data center is lost
- ISP failure
- Switch failure
- Hard disk failure
- Messaging infrastructure failure
- Large scale denial of service attack
- Solution failure (bug in your code)
- Product failure (bug in product code)
- Network failure
- …
Putting in place plans and processes for all eventualities is expensive, so start small, but understand where you are vulnerable, and ensure that the expected response is understood by the organization as a whole.
Documentation
People in your operations team will leave and new hires will arrive. It is important therefore that you have a good set of (up to date!) documentation on how to manage the infrastructure and the solution.
End To End Automation from Dev to Ops
You need a bullet proof process to move configurations and code from your developers’ laptops into your staging, test and production environments. There are many tools that attempt to solve this problem, but the basic goals are to understand:
- What do we have running in an environment?
- What versions of the solution?
- What versions of the product code (fixpack level)?
- How is the OS, JVM, server configured?
- How can we ensure that unit and functional tests that pass in a developer’s environment will also pass in staging, test and production?
- How do we promote code and configurations from development to test, staging and production?
- How do we manage environment specific configuration information? E.g. the physical connection information for databases and messaging infrastructure is likely to be different between environments.
- How do we support development of new N+1 functionality, while ensuring that version N is stable and running in production? Can we patch version N easily while working on version N+1?
Key product capabilities:
- Automating the build of your ODM Insights solutions
- Automating the deployment of your ODM Insights solutions
- Management scripts to automate a wide variety of ODM Insights tasks
There are a very wide variety of tools that people apply to this challenge. Here’s just a sample:
Building the Operations Center
You’ve sized your ODM Insights solution, and you need to monitor potentially dozens of servers to give you the high-availability and throughput that you need. You will want to aggregate a wide variety of information from all the servers and bring it into a central place (the Operations Center) for monitoring.
Log Aggregation
Logs are a goldmine of information, but this information is often difficult to consume and exploit. A key capability is to be able to stream log events from a distributed set of servers into a centralized location for storage, index, search and analytics. Luckily there are some very powerful tools that you can use to aggregate, filter, transform, index, search and visualize information in logs. These include:
- IBM Operational Analytics – Log Analysis
- ODM Insights ships with IBM SmartCloud Analytics Embedded, which is a basic version of IBM Operational Analytics – Log Analysis. You can deploy and use it at no additional cost for your ODM Insights solutions.
- Logstash
- The “L” in the ELK acronym (Elasticsearch, Logstash, Kibana) a very popular Open Source log aggregator that can be integrated with IBM Operational Analytics
IBM Operational Analytics has a very nice catalog of Insight Packs that provide pre-built integrations and visualizations for a very wide range of software and hardware.
What To Monitor?
Once your log aggregation tool is bringing all your logs into a centralized location you will want to consider in more details what you should be monitoring. The typical running ODM Insights solution runs on a stack as shown below:

You will potentially want to monitor each of the boxes in this diagram, as a performance degradation or failure anywhere will impact the availability of your solution. Some key metrics to get you started:
- Is the server running?
- What is the CPU utilization?
- Are the disks getting full?
- Is the network traffic normal?
- What is the JVM heap utilization?
- Are there warnings or errors in the server logs?
- How is the database performing?
- How is JMS performing? What is the age of the messages?
- Is the Insights inbound event queue growing in size? How does the queue size vary over time? Do we have peaks in load where the system is struggling to keep up?
- Is the Insights outbound event queue growing in size? How does the queue size vary over time? Do we have peaks in load where the outbound systems are struggling to keep up?
- What is the time taken for an agent to process an event type? How is it evolving over time, particularly as the event history is building up?
- What is the time taken for the solution to process an event type? How is it evolving over time, particularly as the event history is building up?
- What are GC pause times? How frequently does the JVM run a full GC?
A good way to discover and experiment with the statistics exposed over JMX is to use jconsole (which ships with the Java VM). You can use a single jconsole instance to connect to remote JVMs and then browse their JMX MBeans to see the wide variety of metrics available.
Here’s a batch file that will help you launch jconsole and then connect to a remote JVM over HTTPS:
REM service:jmx:rest://hostname:9443/IBMJMXConnectorREST
REM username is tester
REM password is tester
REM you can set -J-Djavax.net.debug=ssl to help debug
REM **NOTE** SSL host name verification is disabled.
C:/IBM/ODMInsights871/jdk/bin/jconsole
-J-Djava.class.path=C:/IBM/ODMInsights871/jdk/lib/jconsole.jar;
C:/IBM/ODMInsights871/jdk/lib/tools.jar;
C:/IBM/ODMInsights871/runtime/wlp/clients/restConnector.jar
-J-Dcom.ibm.ws.jmx.connector.client.disableURLHostnameVerification=true
-J-Djavax.net.ssl.trustStore=C:/IBM/Solutions/Config/key.jks
-J-Djavax.net.ssl.trustStorePassword=tester
-J-Djavax.net.ssl.trustStoreType=jks
References:
- ODM Insights REST API
- ODM Insights JMX MBeans:
- JMX MBeans for JVM Monitoring
- Insight Packs for IBM Log Analysis
- Gathering machine stats and sending to ELK:
Alarms
Once you have started gathering your data and understand the “normal” behavior of your system and your SLAs you will want to put in place some automated alarms so that operations support personnel are proactively notified if the system starts to deviate from “normal”, or SLAs are being violated. Both IBM Log Analysis Server and Logstash can be used to define alert conditions, including threshold alerts that monitor the occurrence of log messages, or the numeric values within log messages.

Log Analysis Server makes it very easy to call REST APIs, send emails or execute shell scrips when an alert needs to be raised. You can use tools like IBM Control Desk or PagerDuty to decide who to call and how to reach them when an alert is raised.
Dashboards
Some metric (particularly historical trends) are best viewed on a dashboard. You can use the Kibana Open Source project to visualize data gathered using Logstash or you can use IBM Log Analysis Server, which has a built in index, search and dashboard capability.

Kibana Dashboard
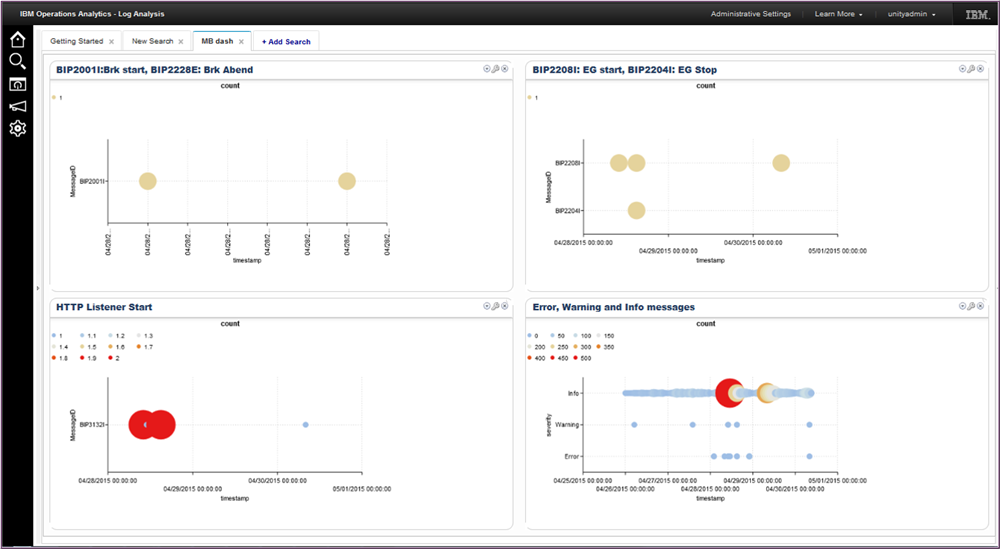
IBM Log Analysis Server Dashboard
When Things Go Wrong
Sometimes things go wrong and it’s best to be prepared rather than having to react when stress levels are high. Ideally one of your automated alerts has been raised and your engineer on call is in your Operations Center.
Alternatively one of your end users has reported an issue, through your Trouble Ticket system.
Your engineer on call can then start to use your aggregated logs to try to find the root cause of the failure. Having all the logs indexed and easily searchable through a web interface makes this task infinitely easier; there’s no more logging into remote machines and trying to find the latest logs.
In some cases your analysis will lead you to believe the root cause is in vendor software, so your documentation will guide you in opening a trouble ticket in the vendor’s trouble ticket system. For IBM this is the IBM PMR process. As soon as your ticket is created it will get analyzed and potentially escalated up through L1, L2, to L3 support where developers and support specialists will (in rare circumstances!) produce emergency code fixes and advise on workarounds. The IBM support staff will keep you informed of the progress being made on your issue and any additional information required to analyze or reproduce it. This often includes server logs, but can also include solution archives and other configuration information.
When the issue is resolved you should make sure any changes to configuration or processes are captured (version controlled) and documented.
Conclusions
I hope this article is not too daunting! If you want to start small and get started I’d strongly encourage you to deploy IBM Log Analysis Server (you could start with the free edition) or Logstash and bring all your server logs into a centralized location for index and search. You can then use a simple dashboard and jconsole to start to monitor the following vital server and solution statistics:
- Solution status: SolutionsMXBean
- Servers in the grid: ServerAdminMXBean
- Size of the inbound event queue: InboundEndpointMonitorMXBean
- Size of the outbound event queue: OutboundBufferManagerMXBean
- Time to process each inbound event type: AgentStatsMXBean
- JVM Heap utilization: MemoryMXBean
- Garbage Collection: GarbageCollectorMXBean
Note that on WAS Liberty the restConnector exposes all MBeans over a REST API if you want to access them from non Java applications.
These basic metrics will give you good visibility into the health of your servers and should help you detect and react to issues before they become critical.
[…] View the full article […]