News
Abstract
General monitor information applicable to both Message and System Monitors
Content
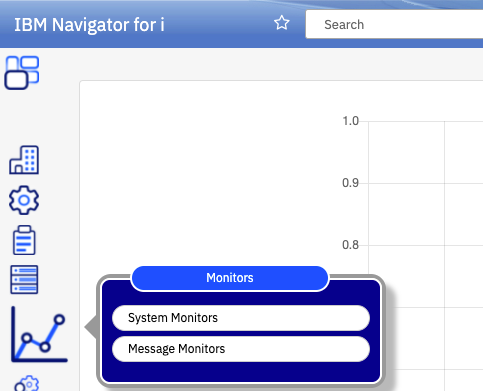
Monitors Overview
Available on the new IBM Navigator for i 7.3 and later releases
<Introduction
Monitors provide a tool for you to watch for the occurrence of messages on your system and carry out predefined actions when a specific event occurs. Monitors continue to monitor and perform any commands or actions you specified as a threshold until you stop the monitor.
Sections:
See also:
- Message Monitors overview
- System Monitors overview
- Send email or text as a monitor action
- Event log does not show triggered events...
- Deleting a user profile that owns a monitor
- How to Start Monitor Server from another node
Overview
IBM Navigator for i provides the following types of monitors:
| Collect and display performance data as it happens. System monitors use Collection Services data to track the metrics of system performance that you select. Detailed graphs help you visualize what is going on with your system as it happens. Choose from various metrics (performance measurements) to pinpoint specific aspects of system performance. |
- Message monitor
|
Find out whether your application completes successfully or monitor for specific messages that are critical to your business needs. You can see the details of a message, reply to a message, send a message, delete a message, and view or change the properties of a message. Under the Monitors folder in the navigation area, users can access the system & message monitor lists. From the message lists, users can create, modify, start, or stop a monitor, and also can view event log list. . |
Authority
If a userid does not have *ALLOBJ authority (that is, User Class *SECOFR authority with *ALLOBJ removed), it needs to be added to the QNAVMNTR (new) authorization list.
Adding to the authorization list is done with the IBM Navigator for i GUI interface or through the green screen command line: ADDAUTLE AUTL(QNAVMNTR) USER(<usrprf>) AUT(*ALL).
A user has to be able to issue a CREATE or REPLACE ALIAS command to the QTEMP directory. If the user cannot perform this, the monitor triggers will not be visible in the charts for System Monitors or Performance Data Investigator (PDI).
For more detail, see: Authority for Monitors in Navigator
Stop Monitor Server
Use the "Stop Monitor Server" action to end the server before you apply PTFs.
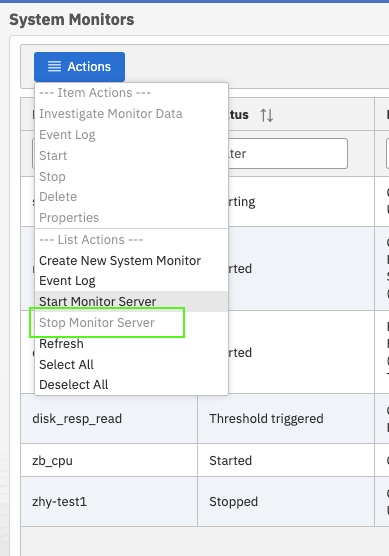
Figure 11
Copy a Monitor to another System
You can use the "Copy to System" function to copy a specific monitor to any system listed in the Target System List. 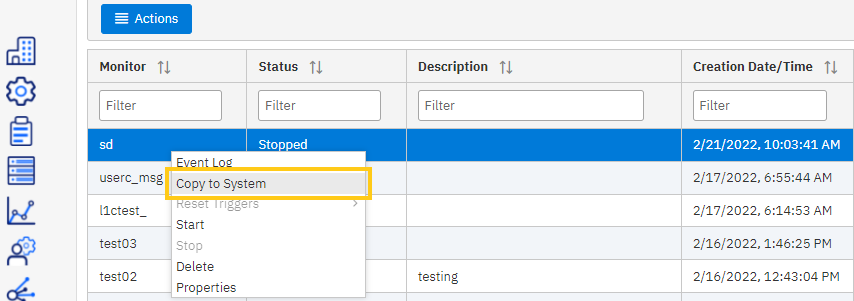
Figure 12
Select a system and click OK.
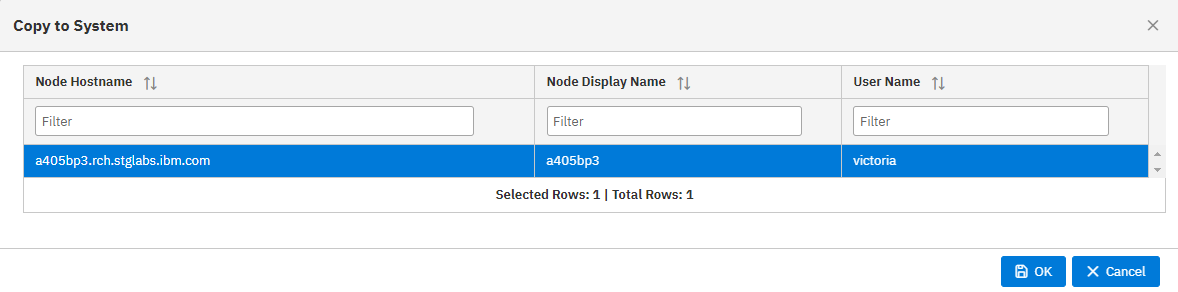
Figure 13
Replacement Variables
Replacement variables are available for both System & Message monitors.
Use these links for more information:
The starting/stopping status may occur in the following cases:
1) The system has a new PTF applied or anything that changed the monitor.jar.
If the monitor server job is not restarted, this may cause unexpected behaviors. Unexpected behavior could include the monitors failed while starting or stopping (thus showing it stuck in a state). If this happens, restart the monitor server. The monitor server should be restarted every time the monitor.jar file is updated.
2) Some categories in collection service are configured, but they are not supported for system monitor. This can happen when configuring by CFGPFRCOL command, such as *IOPBASE and *RDMA. This can also cause the system monitor to fail while starting or stopping (and getting left in the starting or stopping state).
If this happens, first reconfigure Collection Services (under the system monitor tab), to remove the unsupported categories. Then restart the monitor server job.
3) Refer to Start Monitor Server without ADMIN1 server running
If it is not one of the above cases and restarting monitor server does not solve the problem, report to service. Development will need to look at the log to find out what happened and debug.
Implementation Details:
Auto restart is supported for system and message monitors.
In the IBM i 7.4 IBM Documentation page, it indicates that the monitors do not auto-start because at release time auto-start was not supported. This statement is incorrect and is updated in the 7.5 IBM Documentation page.
A user can modify a started system or message monitor.
Design details for monitors functionality
A daemon job QNAVMNSRV (new Navigator) is introduced to provide a monitor service for IBM Navigator for i, which includes data collection and a programmable interface for accessing the data.
These are the details on the directories and programs:
|
Debug files for System Monitors:
Before you report any problems related to system monitors, collect these files before you make any changes to your system to preserve the debug information:
1) In /QIBM/UserData/OS/ADMININST/admin1/wlp/usr/servers/admin1/logs
- messages.log is the file to look at for Navigator errors
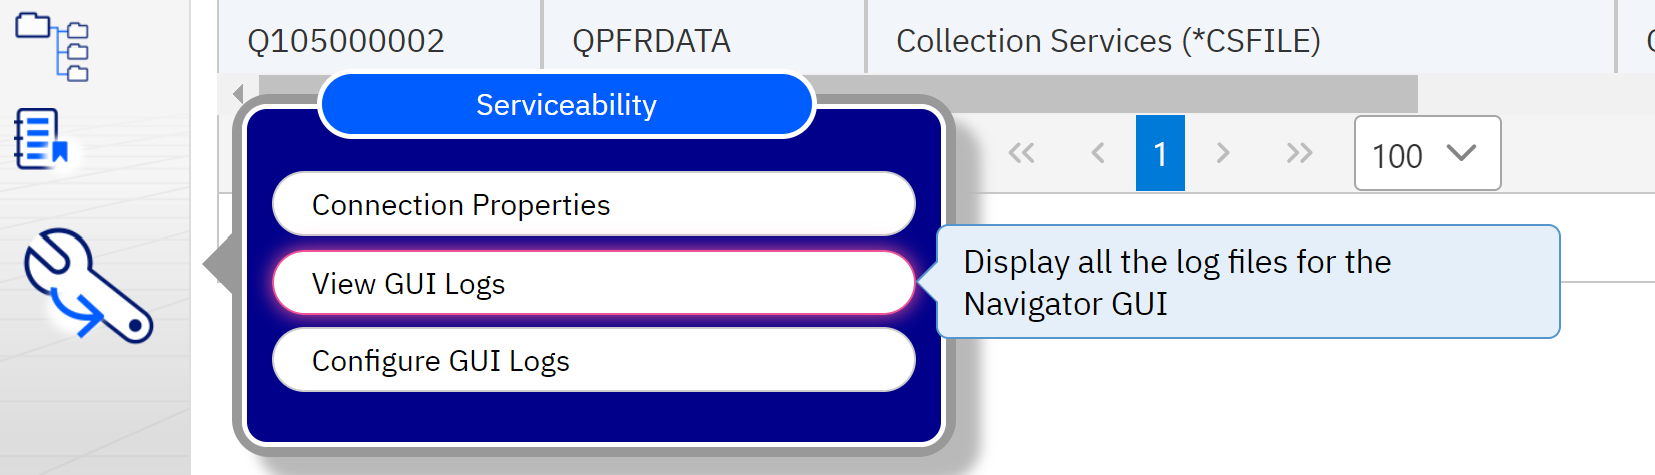
2) For system monitor specific errors, go to "Serviceability" and select "View GUI Logs" to display all the log files for the Navigator GUI:
- Open the monitor files at location /QIBM/UserData/OS400/Navigator/config/MONITOR
- Files:
- navMonStderrA.txt
- navMonStderrB.txt
- navMonStdoutA.txt
- navMonStdoutB.txt
Was this topic helpful?
Document Information
Modified date:
22 May 2025
UID
ibm16561883