Example: Choropleth (Color Map) of Sums
We will now create a map visualization. Then, in the subsequent example, we will create a variation of this visualization. The dataset is worldsales, which is a hypothetical data file that contains sales revenue by continent and product.
- Add a Graphboard node and open it for editing.
- On the Basic tab, select Continent and Revenue. (Use Ctrl+Click to select multiple fields/variables.)
- Select Choropleth of Sums.
- Click the Detailed tab.
- In the Optional Aesthetics group, choose Continent from the Data Label drop-down list.
- In the Map Files group, click Select a Map File.
- In the Select Maps dialog box, check that Map is set to Continents and Map Key is set to CONTINENT.
- In the Compare Map and Data Values groups, click Compare to ensure the map keys match the data keys. In this example, all of data key values have matching map keys and features. We can also see that there is no data for Oceania.
- In the Select Maps dialog box, click OK.
- Click Run.
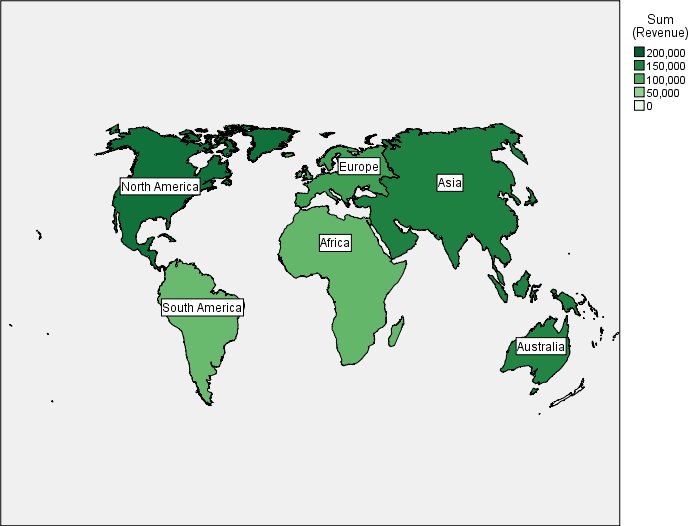
From that map visualization, we can easily see that revenue is highest in North America and lowest in South America and Africa. Each continent is labeled because we used Continent for the data label aesthetic.