Adjusting Web Thresholds
After you have created a web graph, you can adjust the thresholds controlling line styles using the toolbar slider to change the minimum visible line. You can also view additional threshold options by clicking the yellow double-arrow button on the toolbar to expand the web graph window. Then click the Controls tab to view additional options.
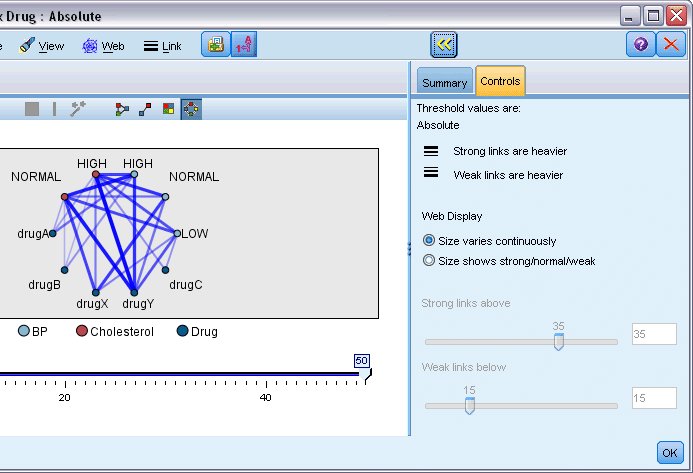
Threshold values are. Shows the type of threshold selected during creation in the Web node dialog box.
Strong links are heavier. Selected by default, this is the standard way of viewing links between fields.
Weak links are heavier. Select to reverse the meaning of links displayed in bold lines. This option is frequently used for fraud detection or examination of outliers.
Web Display. Specify options for controlling the size of links in the output graph:
- Size varies continuously. Select to display a range of link sizes reflecting the variation in connection strengths based on actual data values.
- Size shows strong/normal/weak. Select to display three strengths of connections--strong, normal, and weak. The cutoff points for these categories can be specified above as well as in the final graph.
Strong links above. Specify a threshold for strong connections (heavy lines) and regular connections (normal lines). All connections above this value are considered strong. Use the slider to adjust the value or enter a number in the field.
Weak links below. Specify a number indicating the threshold for weak connections (dotted lines) and regular connections (normal lines). All connections below this value are considered weak. Use the slider to adjust the value or enter a number in the field.
After you have adjusted the thresholds for a web, you can replan, or redraw, the web display with the new threshold values through the web menu located on the web graph toolbar. Once you have found settings that reveal the most meaningful patterns, you can update the original settings in the Web node (also called the Parent Web node) by choosing Update Parent Node from the Web menu in the graph window.