Using a Web Graph
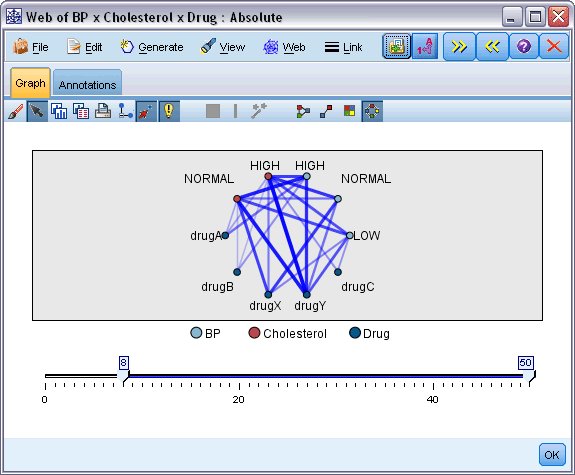
Web nodes are used to show the strength of relationships between values of two or more symbolic fields. Connections are displayed in a graph with varying types of lines to indicate connections of increasing strength. You can use a Web node, for example, to explore the relationship between cholesterol levels, blood pressure, and the drug that was effective in treating the patient's illness.
- Strong connections are shown with a heavy line. This indicates that the two values are strongly related and should be further explored.
- Medium connections are shown with a line of normal weight.
- Weak connections are shown with a dotted line.
- If no line is shown between two values, this means either that the two values never occur in the same record or that this combination occurs in a number of records below the threshold specified in the Web node dialog box.
Once you have created a Web node, there are several options for adjusting the graph display and generating nodes for further analysis.
For both Web nodes and Directed Web nodes, you can:
- Change the layout of the web display.
- Hide points to simplify the display.
- Change the thresholds controlling line styles.
- Highlight lines between values to indicate a "selected" relationship.
- Generate a Select node for one or more "selected" records or a Derive Flag node associated with one or more relationships in the web.
To adjust points
- Move points by clicking the mouse on a point and dragging it to the new location. The web will be redrawn to reflect the new location.
- Hide points by right-clicking on a point in the web and choosing Hide or Hide and Replan from the context menu. Hide simply hides the selected point and any lines associated with it. Hide and Replan redraws the web, adjusting for any changes you have made. Any manual moves are undone.
- Show all hidden points by choosing Reveal All or Reveal All and Replan from the Web menu in the graph window. Selecting Reveal All and Replan redraws the web, adjusting to include all previously hidden points and their connections.
To select, or "highlight," lines
Selected lines are highlighted in red.
- To select a single line, left-click the line.
- To select multiple lines, do one of the following:
- Using the cursor, draw a circle around the points whose lines you want to select.
- Hold down the Ctrl key and left-click the individual lines you want to select.
You can deselect all selected lines by clicking the graph background, or by choosing Clear Selection from the Web menu in the graph window.
To view the web using a different layout
From the Web menu, choose Circle Layout, Network Layout, Directed Layout, or Grid Layout to change the layout of the graph.
Toturn the links slider on or off
From the View menu, choose Links Slider.
To select or flag records for a single relationship
- Right-click on the line representing the relationship of interest.
- From the context menu, choose Generate Select Node For Link or Generate Derive Node For Link.
A Select node or Derive node is automatically added to the stream canvas with the appropriate options and conditions specified:
- The Select node selects all records in the given relationship.
- The Derive node generates a flag indicating whether the selected relationship holds true for records in the entire dataset. The flag field is named by joining the two values in the relationship with an underscore, such as LOW_drugC or drugC_LOW.
To select of flag records for a group of relationships
- Select the line(s) in the web display representing relationships of interest.
- From the Generate menu in the graph window, choose Select Node ("And"), Select Node ("Or"), Derive Node ("And"), or Derive Node ("Or").
- The "Or" nodes give the disjunction of conditions. This means that the node will apply to records for which any of the selected relationships hold.
- The "And" nodes give the conjunction of conditions. This means that the node will apply only to records for which all selected relationships hold. An error occurs if any of the selected relationships are mutually exclusive.
After you have completed your selection, a Select node or Derive node is automatically added to the stream canvas with the appropriate options and conditions specified.