Web Appearance Tab
You can specify appearance options before graph creation.
Title. Enter the text to use for the graph's title.
Subtitle. Enter the text to use for the graph's subtitle.
Caption. Enter the text to use for the graph's caption.
Show legend. You can specify whether the legend is displayed. For plots with a large number of fields, hiding the legend may improve the appearance of the plot.
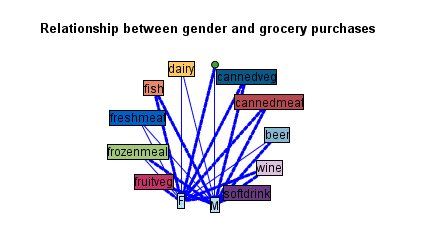
Use labels as nodes. You can include the label text within each node rather than displaying adjacent labels. For plots with a small number of fields, this may result in a more readable chart.
Figure 1. Web graph showing labels as nodes