Crosstabulation
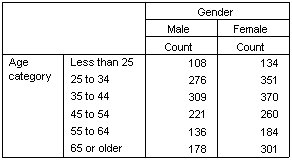
Crosstabulation is a basic technique for examining the relationship between two categorical variables. For example, using Age category as a row variable and Gender as a column variable, you can create a two-dimensional crosstabulation that shows the number of males and females in each age category.
- Open the table builder (Analyze menu, Tables, Custom Tables).
- Click Reset to delete any previous selections in the table builder.
- In the table builder, drag and drop Age category from the variable list to the Rows area on the canvas pane.
- Drag and drop Gender from the variable list to the Columns area on the canvas pane. (You may have to scroll down through the variable list to find this variable.)
- Click OK to create the table.