Marginal Totals
It's fairly common in crosstabulations to display marginal totals--totals for each row and column. Since these aren't included in Custom Tables by default, you need to explicitly add them to your tables.
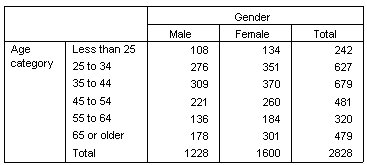
- Open the table builder (Analyze menu, Tables, Custom Tables).
- Click Reset to delete any previous selections in the table builder.
- In the table builder, drag and drop Age category from the variable list to the Rows area on the canvas pane.
- Drag and drop Gender from the variable list to the Columns area on the canvas pane. (You may have to scroll down through the variable list to find this variable.)
- Right-click Age category on the canvas pane and select Categories and Totals from the pop-up menu.
- Select (click) Total in the Categories and Totals dialog box and then click Apply.
- Right-click Gender on the canvas pane and select Categories and Totals from the pop-up menu.
- Select (click) Total in the Categories and Totals dialog box and then click Apply.
- In the Summary Statistics group, select (click) Hide for Position. (Since you're displaying only counts, you don't need to identify the "statistic" displayed in the data cells of the table.)
- Click OK to create the table.