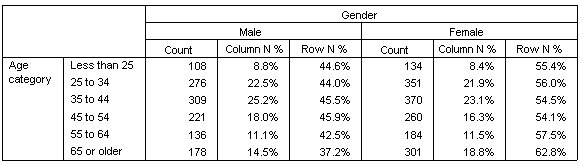
Percentages in Crosstabulations
In a two-dimensional crosstabulation, both row and column percentages may provide useful information.
- Open the table builder again (Analyze menu, Tables, Custom Tables).
- Right-click Gender on the canvas pane.
You may notice that Summary Statistics is disabled in the pop-up menu. This is because you can select summary statistics only for the innermost variable in the statistics source dimension. The default statistics source dimension (row or column) for categorical variables is based on the order in which you drag and drop variables onto the canvas pane. In this example, we dragged Age category to the rows dimension first--and since there aren't any other variables in the rows dimension, Age category is the statistics source variable. You can change the statistics source dimension, but in this example, you don't need to do that. See the topic Summary Statistics for more information.
- Right-click Age category on the canvas pane and select Summary Statistics from the pop-up menu.
- In the Summary Statistics dialog box, select Column N % in the Statistics list and click the arrow to add it to the Display list.
- Select Row N % in the Statistics list and click the arrow to add it to the Display list.
- Click Apply to Selection and then click OK in the table builder to create the table.