A Single Categorical Variable
This example uses the data file survey_sample.sav. See the topic Sample Files for more information.
Although a table of a single categorical variable may be one of the simplest tables you can create, it may often be all you want or need.
- From the menus,
choose:
- In the table builder, drag and drop Age category from the variable list to the
Rows area on the canvas pane.
A preview of the table is displayed on the canvas pane. The preview doesn't display actual data values; it displays only placeholders where data will be displayed.
- Click OK to create the table.
The table is displayed in the Viewer window.
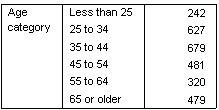
Figure 1. Single categorical variable in rows 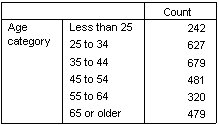
In this simple table, the column heading Count isn't really necessary, and you can create the table without this column heading.
- Open the table builder again (Analyze menu, Tables, Custom Tables).
- In the Summary Statistics group, select (click) Hide for Position.
- Click OK to create the table.