Controlling Display Format
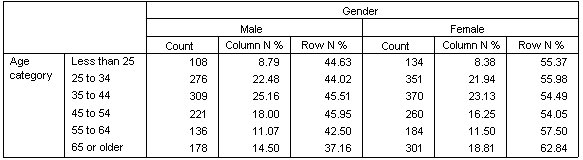
You can control the display format, including the number of decimals displayed in summary statistics. For example, by default, percentages are displayed with one decimal and a percent sign. But what if you want the cell values to show two decimals and no percent sign?
- Open the table builder (Analyze menu, Tables, Custom Tables).
- Right-click Age category on the canvas pane and select Summary Statistics from the pop-up menu.
- For the two selected percentage summary statistics (Column N % and Row N %), select nnnn.n from the Format drop-down list and type 2 in the Decimals cell for both of them.
- Click OK to create the table.