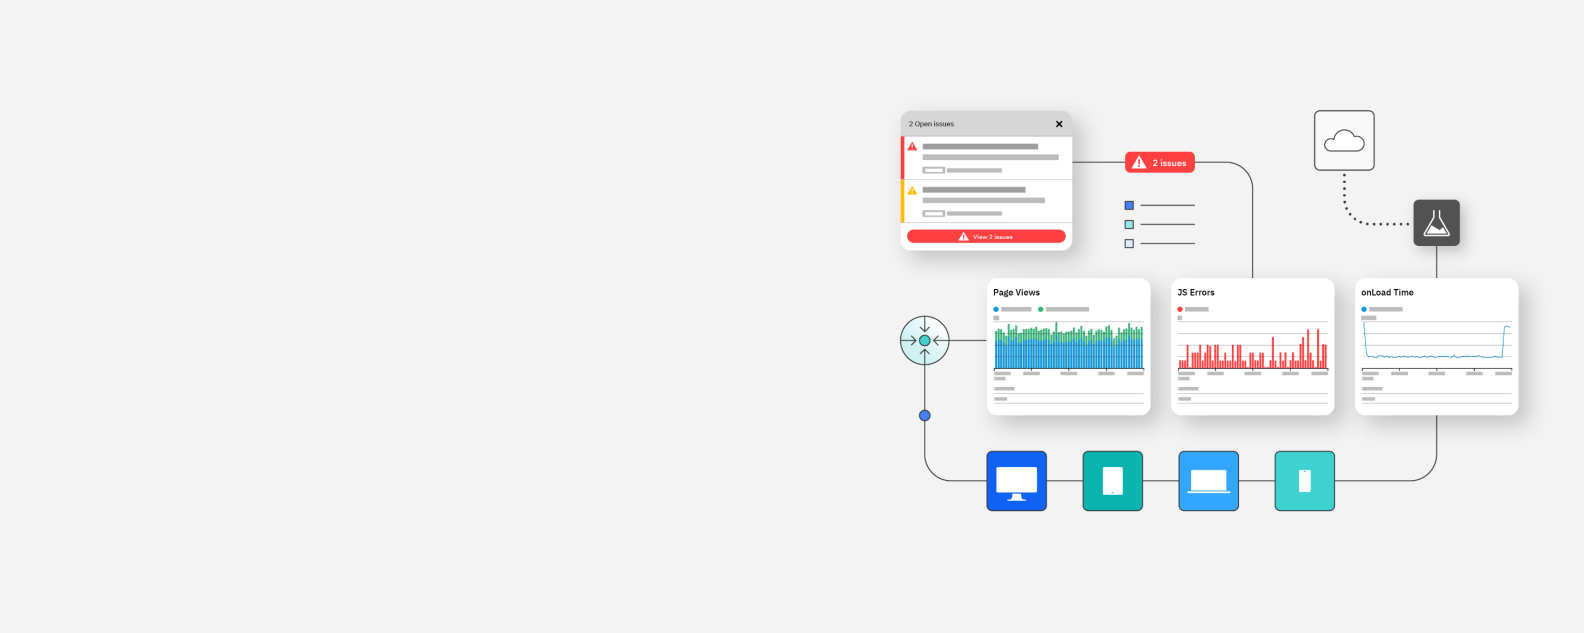
For businesses advancing their digital transformation initiatives, it is crucial to understand how users interact with their digital endpoints—applications, websites, mobile apps or other online services—and proactively resolve any issues that might lead to an unpleasant user experience. However, as IT environments become more complex and fragmented, it can become quite difficult for ITOps teams to gain end-to-end visibility into user journeys and ensure a positive, seamless end-user experience across these endpoints.
Digital experience monitoring (DEM) with IBM® Instana® Observability makes it possible for your IT teams to observe application performance issues in real time, from an end user’s perspective. With AI-powered, full-stack observability and contextual metrics, Instana helps identify performance issues across endpoints, user devices and user journeys. Automatic, distributed tracing accelerates root cause determination and incident prevention or remediation. With Instana, you can also optimize the responsiveness of your digital endpoints, reduce downtime drive business outcomes and deliver better experiences to your users.
Continuously monitor and analyze user experiences across critical endpoints to understand user journeys, preferences and patterns. Insights from end-user experience monitoring (EUEM) not only help improve the existing user experience but also help innovate at speed to exceed user expectations.
Instana's performance analytics feature provides a wealth of data and insights into your application's performance, including metrics such as page load times, resource utilization and more. Instana uses AI and machine learning to automatically analyze data, identify patterns and alert teams to potential issues before they affect users.
Instana’s DEM capability combines RUM and SM data, which provides a single source of truth for user experience monitoring data. This helps ITOps and development teams better understand user activity and preferences to troubleshoot user experience issues as efficiently as possible.
Instana integrates with other monitoring tools, such as log management and network monitoring tools like IBM® Turbonomic®, to provide a comprehensive view of application performance across the entire IT infrastructure with no plug-ins or application restarts.
Technical questions
Synthetic monitoring can simulate actions that an end user takes on an application from different locations and helps continuously monitor user sessions and user actions at a specific interval for performance characteristics like availability and response time.
Instana synthetic monitoring allows you to create synthetic tests to monitor an application. For example, you can write an HTTPAction or a ping test to monitor the availability of your websites. These tests can be configured to run at specific continuous intervals. You can also create a smart alert to inform you if the tests fail.
With smart alerts, you can get alerted when a synthetic test for a location of your interest fails unexpectedly. More blueprint types for other alerting use cases will be added soon. Smart alerts for synthetic monitoring can be created by using the API or through the user interface. You can find more information here.
Cloud migration with IBM Instana Observability helps you plan and execute a move from on-premises data centers to cloud while maintaining application performance and stability every step of the way.
IBM Instana Observability helps you get a comprehensive, centralized view of the health and performance of your entire IT ecosystem in a single dashboard.
