Using a Multiplot Graph
Plots and multiplots are essentially plots of X against Y. For example, if you are exploring potential fraud in agricultural grant applications, you might want to plot the income claimed on the application versus the income estimated by a neural net. Using an overlay, such as crop type, will illustrate whether there is a relationship between claims (value or number) and type of crop.
Figure 1. Plot of the relationship
between estimated income and claim value with main crop type as an
overlay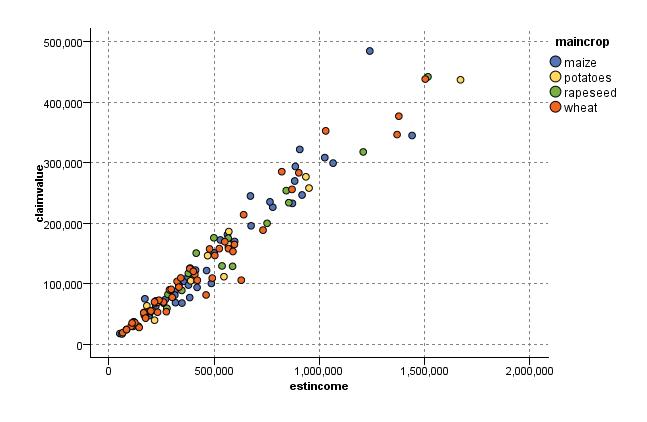
Since plots, multiplots, and evaluation charts are two-dimensional displays of Y against X, it is easy to interact with them by defining regions, marking elements, or even drawing bands. You can also generate nodes for the data represented by those regions, bands, or elements. See the topic Exploring Graphs for more information.