Multiplot Plot Tab
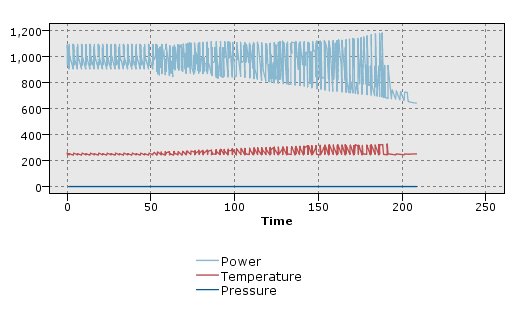
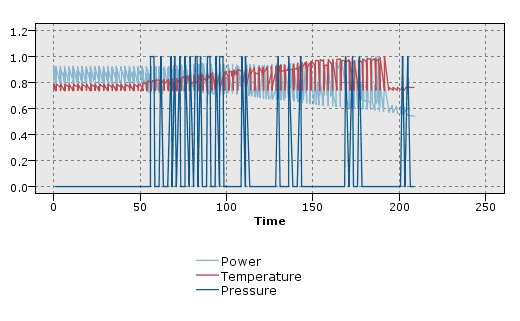
A multiplot is a special type of plot that displays multiple Y fields over a single X field.
X field. From the list, select the field to display on the horizontal x axis.
Y fields. Select one or more fields from the list to display over the range of X field values. Use the Field Chooser button to select multiple fields. Click the delete button to remove fields from the list.
Overlay. There are several ways to illustrate categories for data values. For example, you might use an animation overlay to display multiple plots for each value in the data. This is useful for sets containing upwards of 10 categories. When used for sets with more than 15 categories, you may notice a decrease in performance. See the topic Aesthetics, Overlays, Panels, and Animation for more information.
Normalize. Select to scale all Y values to the range 0–1 for display on the graph. Normalizing helps you explore the relationship between lines that might otherwise be obscured due to differences in the range of values for each series and is recommended when plotting multiple lines on the same graph, or when comparing plots in side-by-side panels. (Normalizing is not necessary when all data values fall within a similar range.)
Overlay function. Select to specify a known function to compare to actual values. For example, to compare actual versus predicted values, you can plot the function y = x as an overlay. Specify a function for y = in the text box. The default function is y = x, but you can specify any sort of function, such as a quadratic function or an arbitrary expression, in terms of x.
Note: Overlay functions are not available for a panel or animation graph.
When number of records greater than. Specify a method for plotting large datasets. You can specify a maximum dataset size or use the default 2,000 points. Performance is enhanced for large datasets when you select the Bin or Sample options. Alternatively, you can choose to plot all data points by selecting Use all data, but you should note that this may dramatically decrease the performance of the software.
Note: When X Mode is set to Overlay or As Read, these options are disabled and only the first n records are used.
- Bin. Select to enable binning when the dataset contains more than the specified number of records. Binning divides the graph into fine grids before actually plotting and counts the number of connections that would appear in each of the grid cells. In the final graph, one connection is used per cell at the bin centroid (average of all connection points in the bin).
- Sample. Select to randomly sample the data to the specified number of records.