Multiplot Appearance Tab
You can specify appearance options before graph creation.
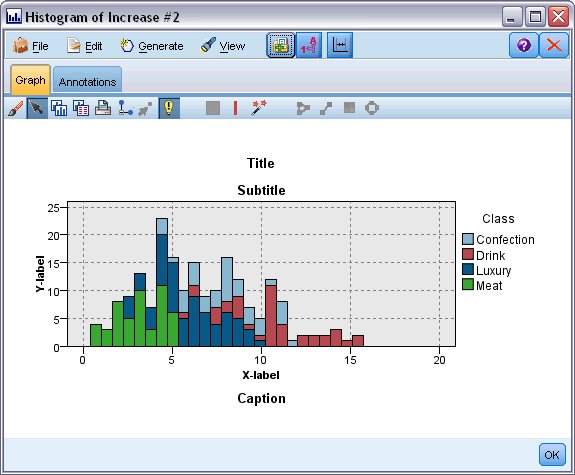
Title. Enter the text to use for the graph's title.
Subtitle. Enter the text to use for the graph's subtitle.
Caption. Enter the text to use for the graph's caption.
X label. Either accept the automatically generated x-axis (horizontal) label or select Custom to specify a label.
Y label. Either accept the automatically generated y-axis (vertical) label or select Custom to specify a label.
Display gridline. Selected by default, this option displays a gridline behind the plot or graph that enables you to more easily determine region and band cutoff points. Gridlines are always displayed in white unless the graph background is white; in this case, they are displayed in gray.
The following example shows where appearance options are placed on a graph. (Note: Not all graphs use all these options.)