Exploring Graphs
While Edit mode allows you to edit the graph's layout and look, Explore mode allows you to analytically explore the data and values represented by the graph. The main goal of exploration is to analyze the data and then identify values using bands, regions, and marking to generate Select, Derive, or Balance nodes. To select this mode, choose View > Explore Mode from the menus (or click the toolbar icon).
While some graphs can use all of the exploration tools, others accept only one. Explore mode includes:
- Defining and editing bands, which are used to split the values along a scale x axis. See the topic Using Bands for more information.
- Defining and editing regions, which are used to identify a group of values within the rectangular area. See the topic Using Regions for more information.
- Marking and unmarking elements to hand select the values that could be used to generate a Select or Derive node. See the topic Using Marked Elements for more information.
- Generating nodes using the values identified by bands, regions, marked elements, and web links to use in your stream. See the topic Generating Nodes from Graphs for more information.
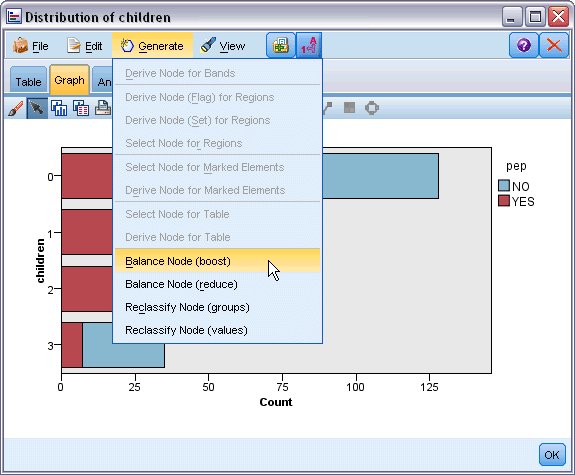
Figure 1. Graph with the generate menu showing