Performance confidence diagram
The accuracy of a performance model is largely determined by two factors:
▪The quality of the input data.
▪The quality of the mathematical model.
Storage Modeller calculates a model confidence value for IBM Storage Virtualize and IBM DS8000 storage systems. The report is displayed on the Performance Reports panel in the form of a
Performance Confidence Diagram (Figure 59 on page 55). The
Performance Confidence Diagram highlights which storage systems' performance results have a higher or lower confidence level, and aids in determining how best to use these performance
results. For example, results with a lower confidence level may lead a user to add better input information. When extreme accuracy is critical to a business outcome, a user might request
additional assistance from a performance expert.
|
Note: The lower-left corner of the diagram typically indicates that storage devices are in the Estimation stage of the calibration process. For details,
about all three stages of calibration, see
“Computation of performance predictions”.
|

Figure 59 Performance Confidence model
Assignment of confidence values to performance results is done in conservative fashion and might yield a lower confidence classification than a user expects. It is important to recognize
that this does not mean that the performance results are suddenly less accurate than in previous releases or than in previous modeling tools. The initial releases of Storage Modeller
already contain significantly improved performance models. They yield more accurate results when compared with previous modeling tools. And as the internal performance models continue to
be improved over time, it is expected that the associated confidence levels in the Performance Confidence Diagram will also increase accordingly.
As previously mentioned, the accuracy of a performance model is determined essentially by two factors: The quality of the input data and the robustness of the mathematical model. The
confidence diagram, as part of the performance report, presents an estimation of these factors as a two-dimensional scatter plot:
▪The Input Quality (X-axis) shows an assessment of the data input quality.
▪The Model Quality (Y-axis) shows an assessment of the mathematical formulas and calibrations used to calculate the output.
Both factors are combined to indicate how reliable the results of the performance model are. The further right or the higher a point is, the more reliable the performance calculation for
this storage system.
|
Important: The assessment is qualitative, not quantitative. For example, doubling a point's Model Quality (Y-axis) value indicates a significantly higher
mathematical validity, but does not mean that the model's potential error is divided by half.
|
Input quality input (X axis)
The quality of the results is dependent on the quality of the Input workload(s). At the low end (left side of the diagram), the model is based on a rough estimate of the workload that
represents the customer's application. When moving further right on the Quality Input axis, the input quality increases, and the model results will be based on more accurate
representations of the actual customer application's I/O behavior.
A user can influence the Input Quality (X-axis) value by filling in the advanced options at the bottom of the workload forms that are associated with the storage system. In future versions
of the Storage Modeller, a higher Input Quality can also be achieved by generating workloads from imported performance statistics. The Storage Modeller will then consider more factors —
such as the number of metrics contained in the imported data, the time range covered, and the sampling interval — as determinants for Input Quality.
Model quality input (Y axis)
Any performance model is only as good as the data that it is based on. In terms of Model Quality, the performance model quality is as good as the performance data that it was created
against. At the low end (vertically lower in
Figure 59 on page 55), the model is based on either older
data or on estimates or expectations. When moving further up on the Model Quality axis, the performance model quality increases as the data on which the model is based gets better, from
data validated via lab measurements, to data verified against real-world customer implementations.
Performance models that are built on estimates or expectations of performance are a new category of performance models in the Storage Modeller. Such models are generally used only for a
short time, typically to enable Storage Modeller performance support of new product releases at Announcement time. Once real systems and measurement data are available, such models are
updated with full calibration. Of course, estimated models are less accurate than fully calibrated models. This difference is reflected in the Performance Confidence Diagram's Model
Quality axis.
A user cannot directly influence the Model Quality (Y-axis) value, which reflects the quality of the internal mathematical model. This confidence is determined first by the system and
product version used. Again, performance models that have been calibrated only against estimates of system performance have a lower quality than models that have been validated against lab
measurements or those that have been verified with customer results. However, a user can indirectly influence the Model Quality by avoiding use of some complex advanced functions such as
Remote Copy and Data Reduction Pools, which reduce the overall model quality.
Printing performance reports
To print a report in Storage Modeller, you must copy and paste the information into a local spreadsheet. The copy function is different depending on the operating system and browser you
are using. In this example, the operating system was Windows and the browser used was Mozilla Firefox.
Table 6 on page 57
shows some operating system shortcuts. In this document, procedural steps reference Windows shortcuts.
Table 6 System keyboard shortcuts
|
Command
|
Windows
|
Linux
|
Mac
|
|---|---|---|---|
|
Copy
|
Ctrl+C
|
Ctrl+C
|
Cmd+C
|
|
Paste
|
Ctrl+V
|
Ctrl+V
|
Cmd+V
|
Steps to print a report in Storage Modeller:
1. Select the area in the report to print (you can select the area by holding down the left mouse button and moving
the mouse over the area you want to copy until it is highlighted gray), as shown in
Figure 60.
2. Then click Ctrl+C to copy the selected area to the clipboard.
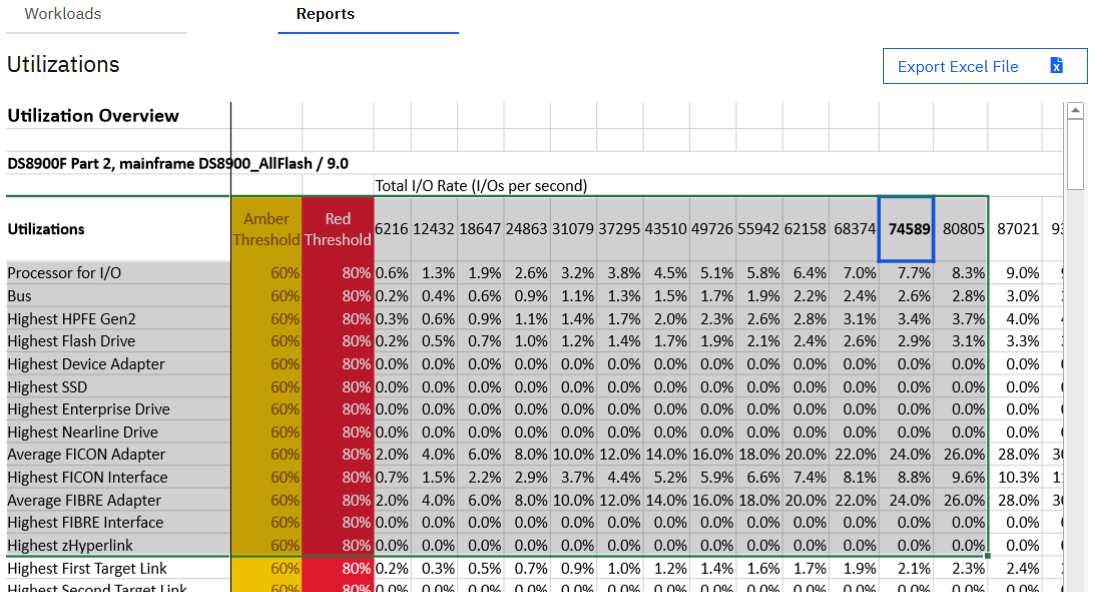
Figure 60 Select the area to print
3. On your local system, open a spreadsheet such as Excel. Place your cursor where you would like to start the
insertion of the copied data, then click Ctrl+V to paste the selected area into the spreadsheet, as shown in
Figure 61. Once the data has been copied you can use your
spreadsheet to manipulate the data as required.
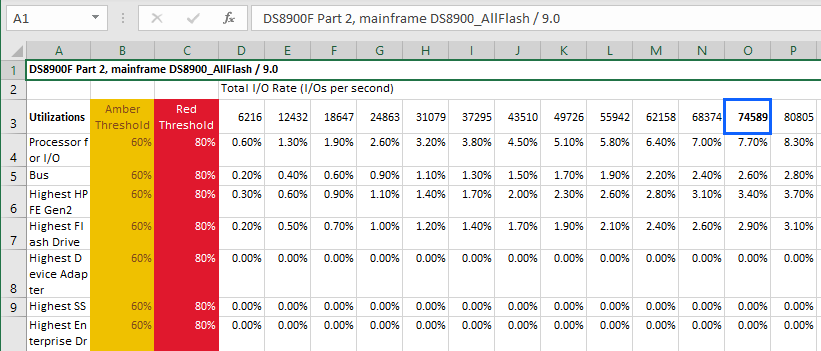
Figure 61 Pasting selected area of Storage Modeller report into Microsoft Excel, partial view