Reliability tab (predictions for the COS system)
|
Tabs of the Projects / project_name / Products list
|
|||
|
System
|
Performance
|
Reliability
|
Report
|
|
Note: You can click any of the following links to learn about the other tabs in this view:
|
This tab informs users about how reliable the configuration is and how durable the data will be. It factors in the probability of natural disasters, weather, loss of power and so on, and
tells you how resilient the system is during those situations. This is the section where you can find the answer to most customer questions on reliability. Customers often want to know how
many 9’s the system qualifies to meet. Those questions can be answered through the Reliability tab. The IDA that is a part of your Custom Design or Quick Select Design for Capacity
Modeling of the IBM COS determines the results that are available in the Reliability tab.
The Reliability tab has the following sections:
▪Downtime
▪Advanced Options
▪Expert Options
▪Legacy COS Calculator Values
▪Data Reliability
▪System Data Availability
▪Site Data Availability
Background calculations and intensive mathematics are used to create the qualifications of the system and project that you have configured. Those are reflected in this tab. You can make
adjustments to Downtime, Advanced Options and Expert Options. See
Figure 312.
|
Note: Unless you are an expert in using these fields, it is not recommended that you edit them. You would get unrealistic calculations if these entries
were edited incorrectly.
|

Figure 312 Reliability tab, top section: Editable fields for calculating reliability numbers
The sections for Data Reliability, System Data Availability and Site Data Availability provide the answers to customer questions regarding reliability and the level of 9s. The number of 9s
are the number of 9s in a percentage of reliability. For example, a 99.999 percent chance is referred to as a reliability of five 9s.
Reliability data is given for the following and shown in
Figure 313 on page 360:
▪Data Reliability: The Mean Time to Data Loss (MTTDL) calculations are shown for either a Permanent or Temporary loss. The probability of that loss is shown as a percentage and in the
amount of years in which it most likely will happen. For example, in
Figure 313 on page 360
the Permanent Data Reliability is rated at seven 9’s.
▪System Data Availability: The Annual Downtime is provided for both Read and Write. It is calculated down to hours and seconds and shows the percentage of probability.
▪Site Data Availability: The Annual Downtime is provided for both Read and Write. It is calculated down to hours and seconds and shows the percentage of probability.
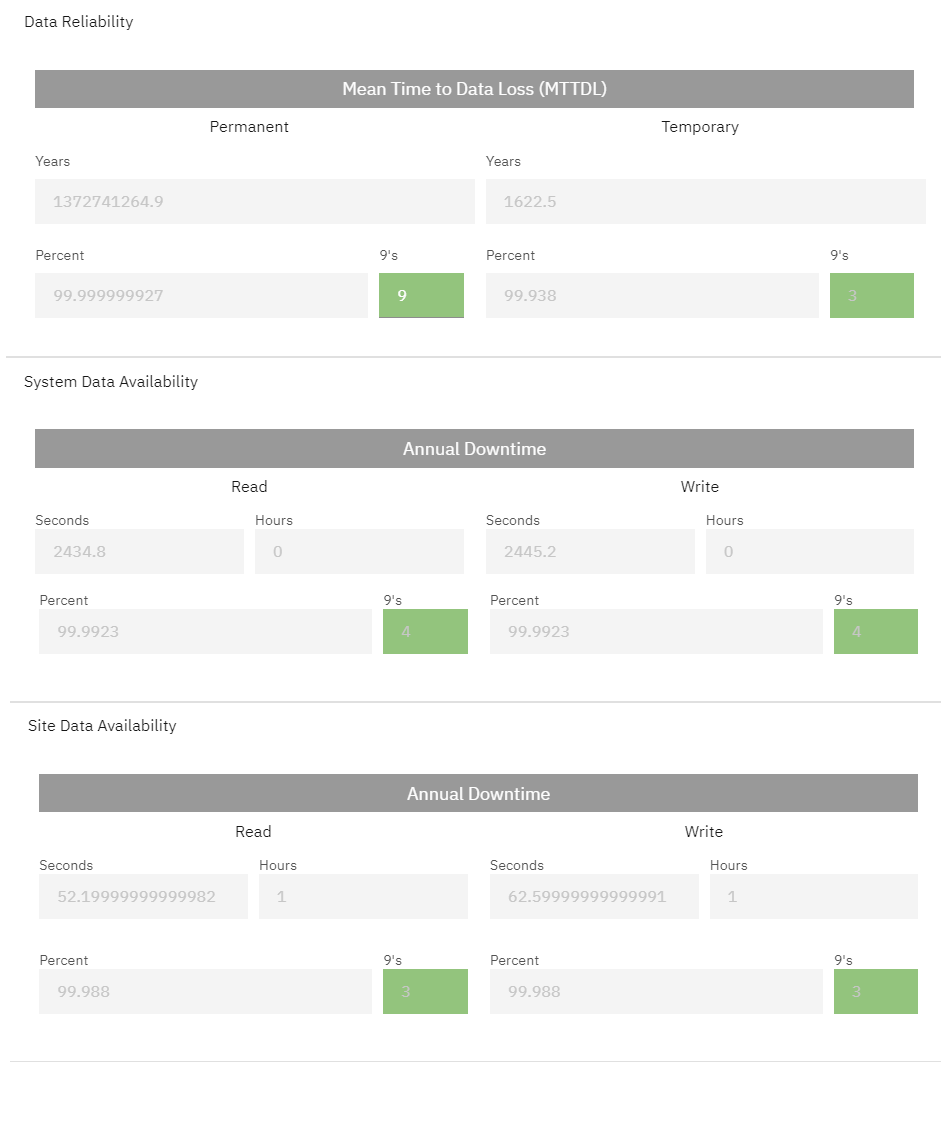
Figure 313 Reliability tab, lower section: Data reliability metrics for a typical IBM COS system
IBM COS systems are able to be dispersed across many sites that are located great distances from each other. This provides unparalleled redundancy and reliability.