News
Abstract
This page is for the heritage version of Navigator Dashboards.
For the new version of Navigator Dashboard, see https://www.ibm.com/support/pages/node/6483563.
Content
Dashboard
IBM Navigator for i 7.3 feature
Introduction
Dashboard is a new feature delivered on IBM Navigator for i 7.3. The dashboard is also available on iAccess Mobile. This document is focused on the Dashboard for IBM Navigator for i.
With the Dashboard, users can view key system data in real-time. This provides visual indicators of overall system status and health.
Background
IBM Navigator for i provides lots of functionalities for analysis and monitoring, such as Performance Data Investigator (PDI) and System Monitors. The goal of the dashboard is to provide a quick and easy way to find overall system status view providing real time data. Currently, the modern web techniques like jquery and Dojo make it easy to build a user-friendly web page. The new Dashboard is built with Dojo, jquery, html5, and other modern web techniques. Users can monitor system heath and do some actions from the Dashboard.
Functions
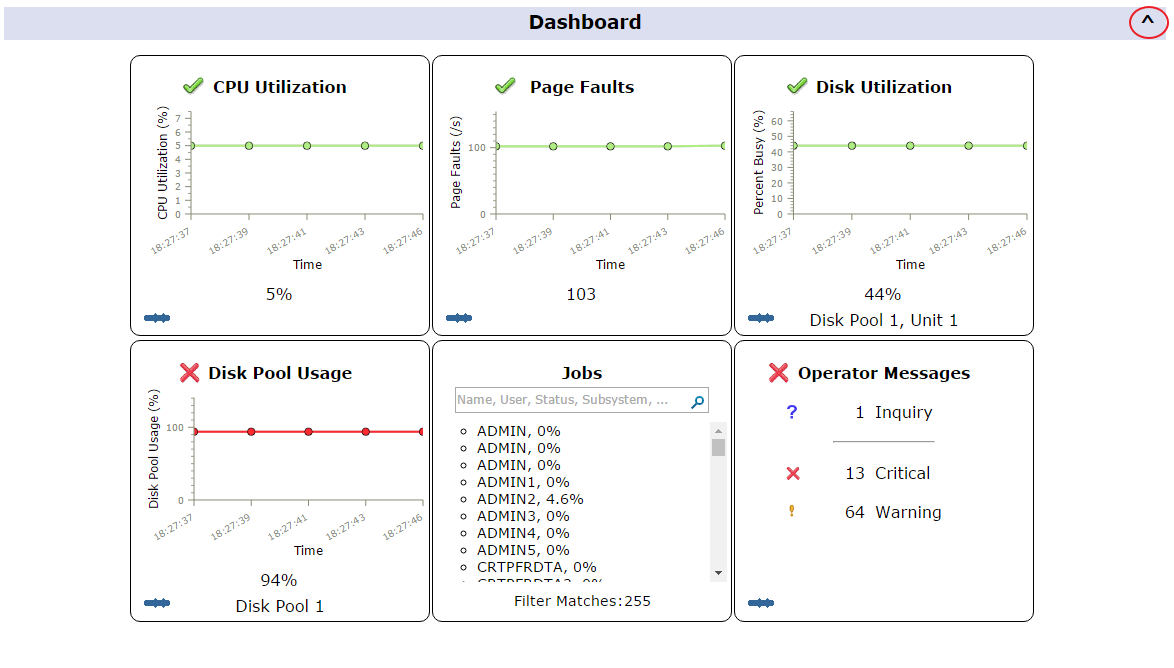
Starting with the 2017 Q1 PTFs, the Dashboard is not opened automatically as the initial page. To open the Dashboard, click the Dashboard link from the left side navigation area. The Dashboard includes CPU Utilization, Page faults, Disk Utilization, Disk Pool Usage, Jobs, and Operator Messages. These are displayed on the dashboard panel in six individual windows. Users can set thresholds, toggle detail information, and perform some actions with a context menu available each window.
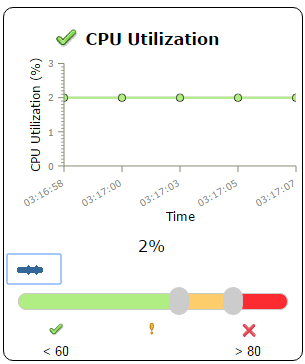
Note: The threshold values are preset, but the values they are preset to are not recommendations. They are not deemed to be the right thresholds for your use. It is a starting point and a value that was determined as a useful point within a range and only a starting point. These are meant to be modified by each user to the values that are appropriate for their system.
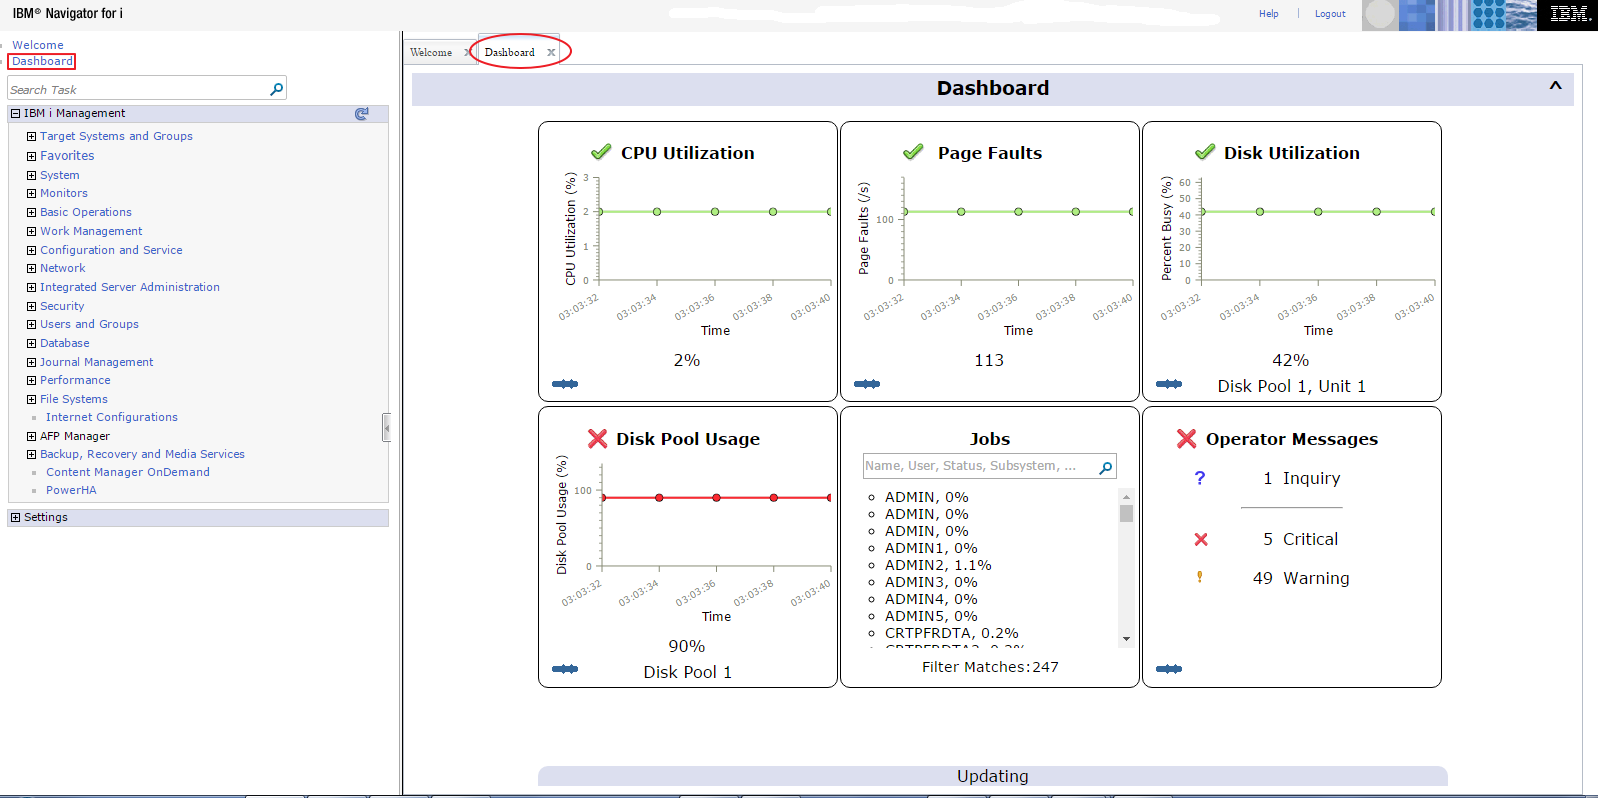 Figure 1
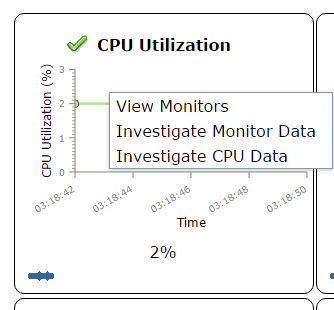
By right-clicking a window, a context menu is shown as in Figure 4.
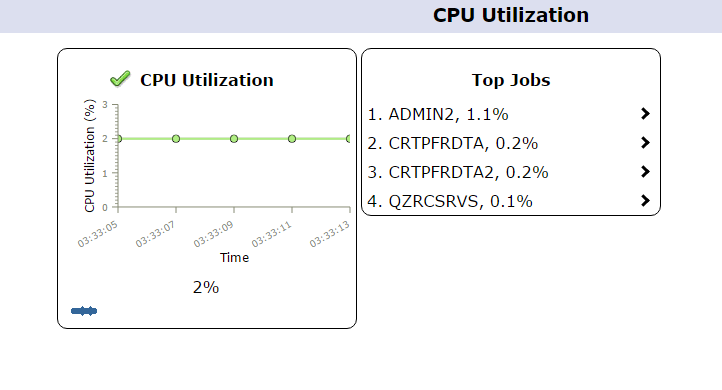
The actions associated with context menu for CPU Utilization are as follows:
View Monitors → Open System monitor list.
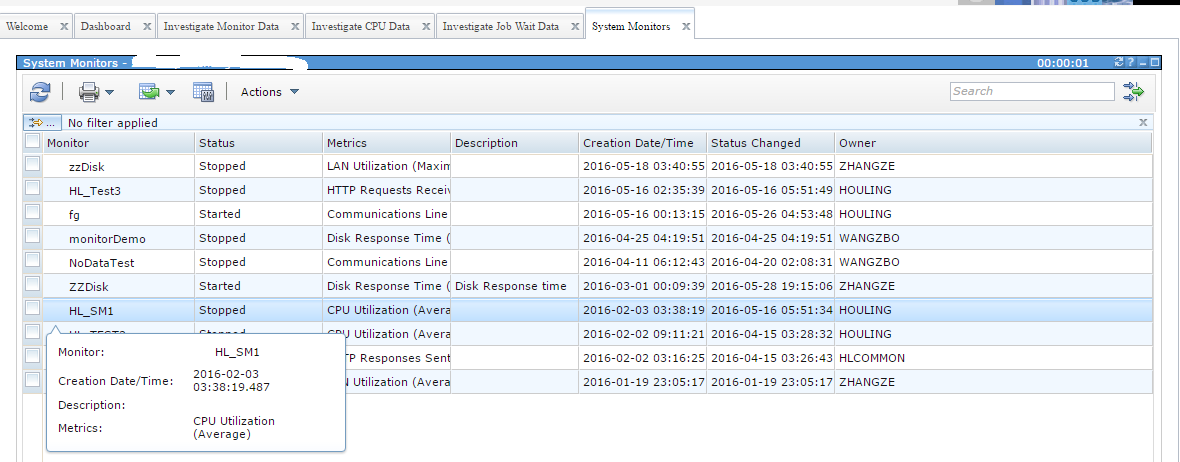


Investigate Job Wait Data → Open PDI’s Waits for One Job or Task chart.
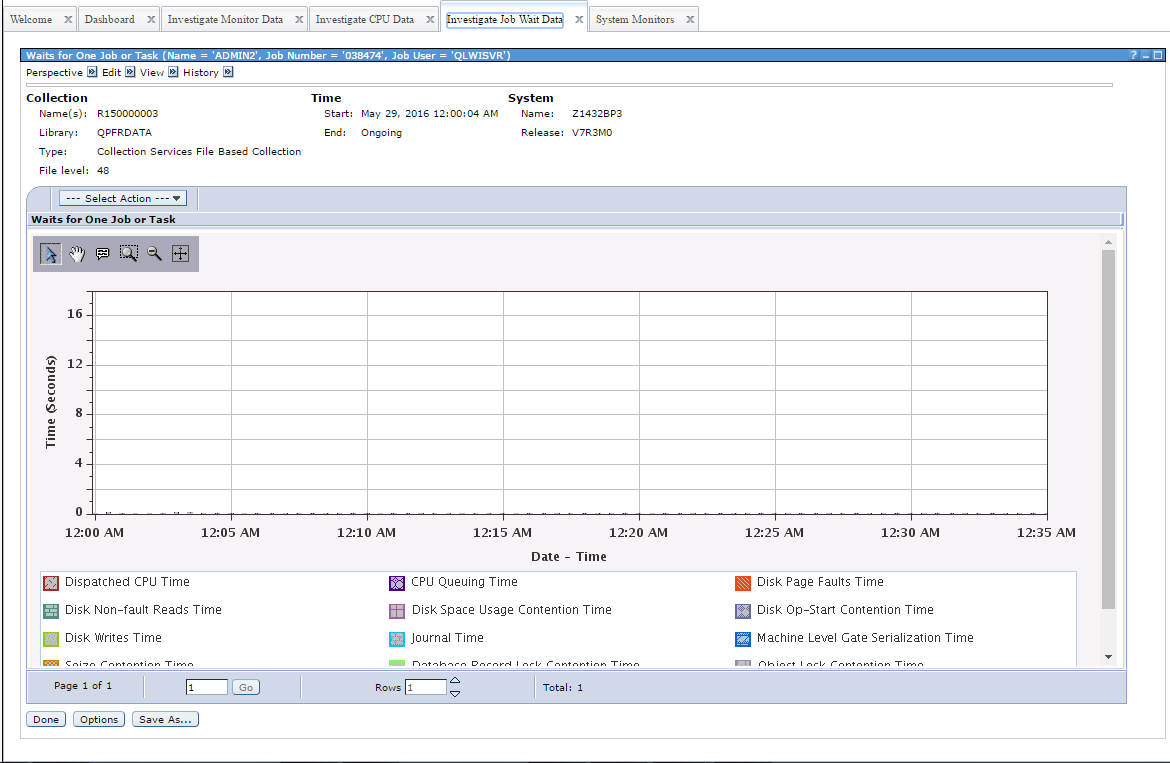
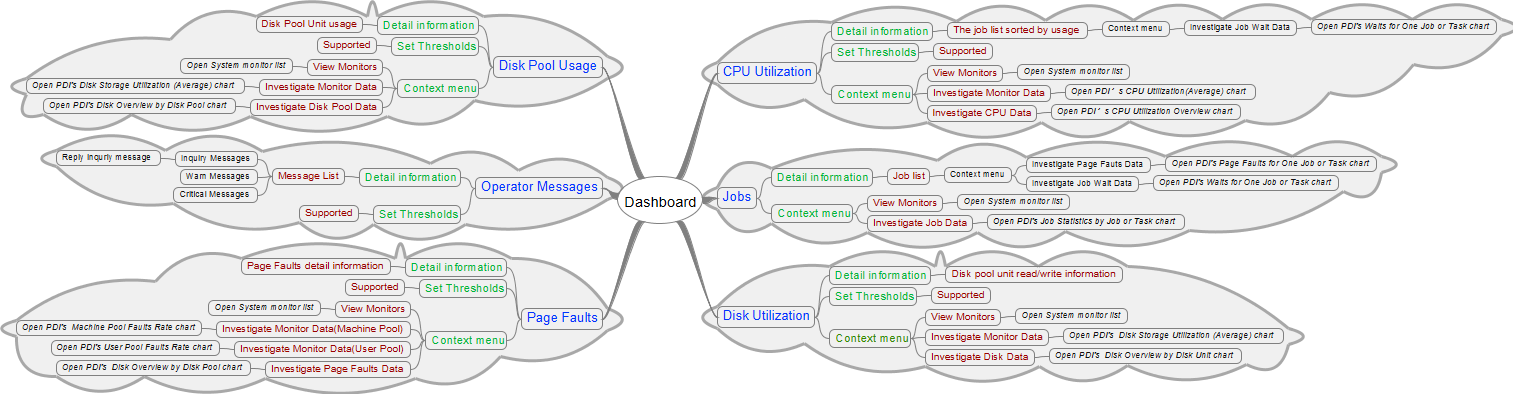 Figure 11
Control
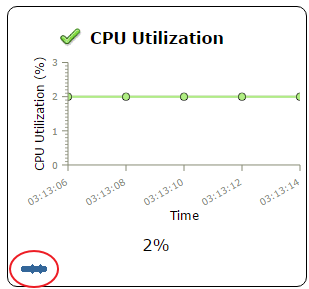
Users can configure the sample rate, sample length and refresh mode from within the control bar.
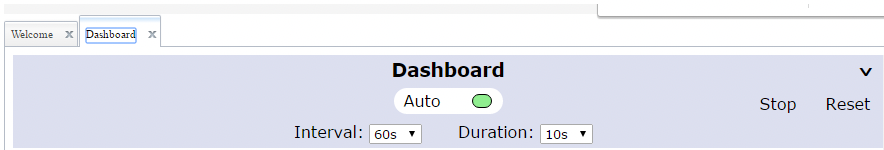
Dashboard has two refresh modes, auto and manual. The default mode is auto. In the auto mode, users can configure interval and duration.
|
Interval - The frequency at which a snapshot of system activity is reported. For best practice, set this interval to 60s or more Duration - The length of time data is collected during the interval. |
In auto mode, users can pause refresh by clicking the "Stop" button, or clear the dashboard values by clicking the "Reset" button.
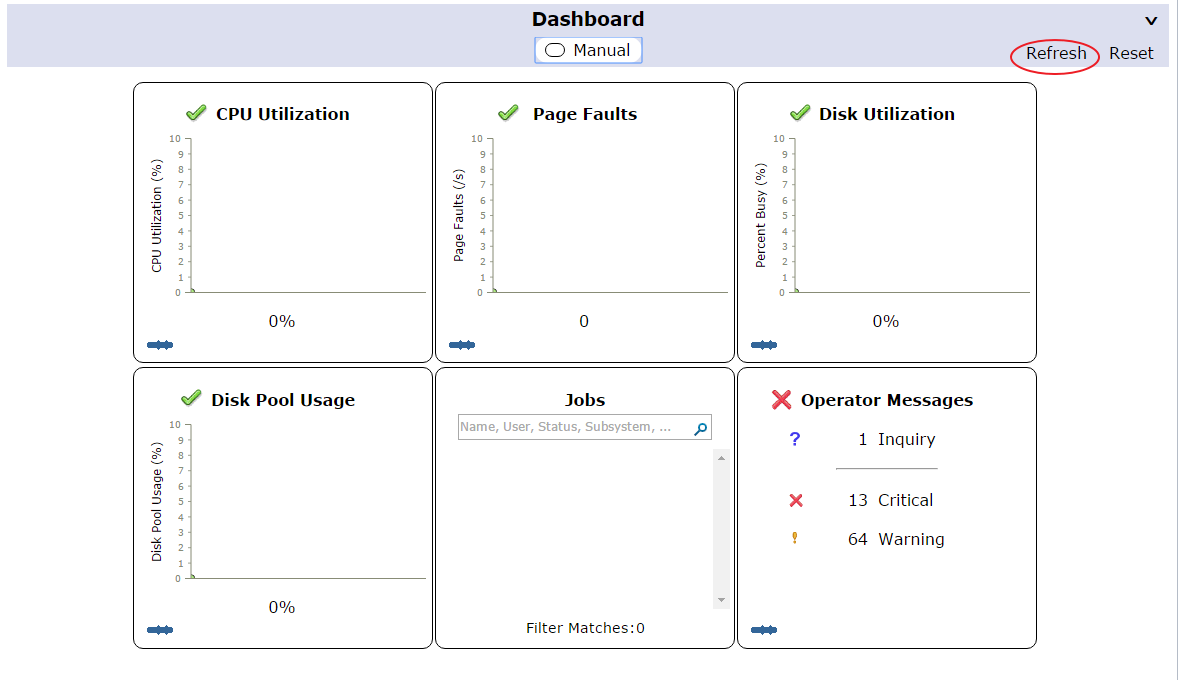
In the manual mode, users can refresh data by clicking the Refresh button. Also, users can reset data by clicking the Reset Button
Was this topic helpful?
Document Information
Modified date:
08 September 2021
UID
ibm11142878