Tree Diagram
The tree diagram is a graphic representation of the tree model. This tree diagram shows that:
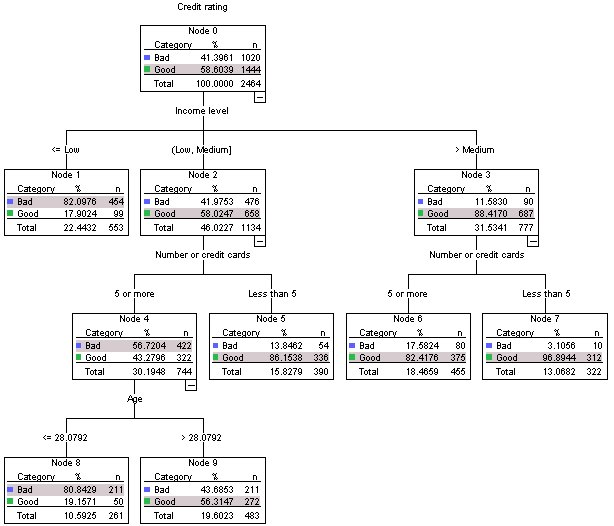
- Using the CHAID method, income level is the best predictor of credit rating.
- For the low income category, income level is the only significant predictor of credit rating. Of the bank customers in this category, 82% have defaulted on loans. Since there are no child nodes below it, this is considered a terminal node.
- For the medium and high income categories, the next best predictor is number of credit cards.
- For medium income customers with five or more credit cards, the model includes one more predictor: age. Over 80% of those customers 28 or younger have a bad credit rating, while slightly less than half of those over 28 have a bad credit rating.
You can use the Tree Editor to hide and show selected branches, change colors and fonts, and select subsets of cases based on selected nodes. See the topic Selecting Cases in Nodes for more information.