Tree Table
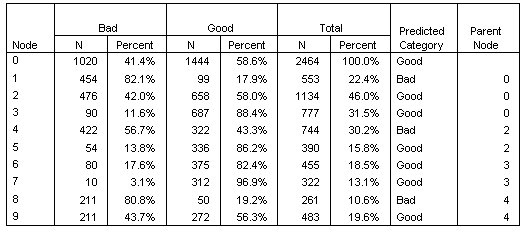
The tree table, as the name suggests, provides most of the essential tree diagram information in the form of a table. For each node, the table displays:
- The number and percentage of cases in each category of the dependent variable.
- The predicted category for the dependent variable. In this example, the predicted category is the credit rating category with more than 50% of cases in that node, since there are only two possible credit ratings.
- The parent node for each node in the tree.
Note that node 1—the low income level node—is not the
parent node of any node. Since it is a terminal node, it has no child
nodes.
Figure 2. Tree table for credit rating (continued) 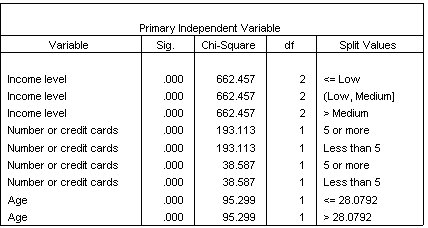
- The independent variable used to split the node.
- The chi-square value (since the tree was generated with the CHAID method), degrees of freedom (df), and significance level (Sig.) for the split. For most practical purposes, you will probably be interested only in the significance level, which is less than 0.0001 for all splits in this model.
- The value(s) of the independent variable for that node.
Note: For ordinal and scale independent variables, you may see ranges in the tree and tree table expressed in the general form (value1, value2], which basically means "greater than value1 and less than or equal to value2." In this example, income level has only three possible values—Low, Medium, and High—and (Low, Medium] simply means Medium. In a similar fashion, >Medium means High.