Gains for Nodes
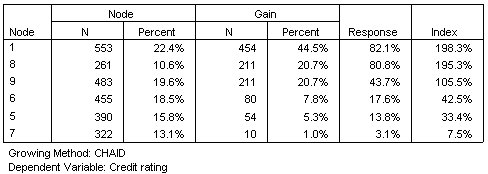
The gains for nodes table provides a summary of information about the terminal nodes in the model.
- Only the terminal nodes—nodes at which the tree stops growing—are listed in this table. Frequently, you will be interested only in the terminal nodes, since they represent the best classification predictions for the model.
- Since gain values provide information about target categories, this table is available only if you specified one or more target categories. In this example, there is only one target category, so there is only one gains for nodes table.
- Node N is the number of cases in each terminal node, and Node Percent is the percentage of the total number of cases in each node.
- Gain N is the number of cases in each terminal node in the target category, and Gain Percent is the percentage of cases in the target category with respect to the overall number of cases in the target category—in this example, the number and percentage of cases with a bad credit rating.
- For categorical dependent variables, Response is the percentage of cases in the node in the specified target category. In this example, these are the same percentages displayed for the Bad category in the tree diagram.
- For categorical dependent variables, Index is the ratio of the response percentage for the target category compared to the response percentage for the entire sample.
Index Values
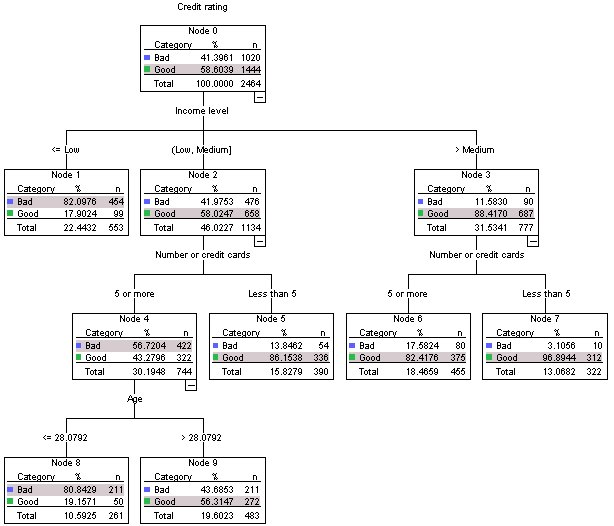
The index value is basically an indication of how far the observed target category percentage for that node differs from the expected percentage for the target category. The target category percentage in the root node represents the expected percentage before the effects of any of the independent variables are considered.
An index value of greater than 100% means that there are more cases in the target category than the overall percentage in the target category. Conversely, an index value of less than 100% means there are fewer cases in the target category than the overall percentage.