Subtotals
This example uses the data file survey_sample.sav. See the topic Sample Files for more information.
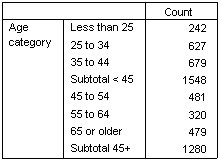
You can include subtotals for subsets of categories of a variable. For example, you could include subtotals for age categories that represent all of the respondents in the sample survey under and over age 45.
- Open the table builder (Analyze menu, Tables, Custom Tables).
- Click Reset to clear any previous settings in the table builder.
- In the table builder, drag and drop Age category from the variable list to the Rows area on the canvas pane.
- Right-click Age category on the canvas pane and choose Categories and Totals from the pop-up menu.
- Select 3.00 in the Value(s) list.
- Click Add Subtotal to display the Define Subtotal dialog box.
- In the Label text field, type Subtotal < 45.
- Then click Continue.
This inserts a row containing the subtotal for the first three age categories.
- Select 6.00 in the Value(s) list.
- Click Add Subtotal to display the Define Subtotal dialog box.
- In the Label text field, type Subtotal 45+.
- Then click Continue.
Important note: You should select the display position for totals and subtotals (Above categories to which they apply or Below categories to which they apply) before defining any subtotals. Changing the display position affects all subtotals (not just the currently selected subtotal), and it also changes the categories included in the subtotals.
- Click Apply and then click OK in the table builder to create the table.