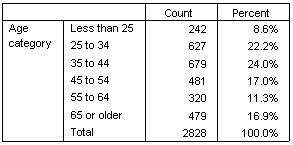
Simple Total for a Single Variable
This example uses the data file survey_sample.sav. See the topic Sample Files for more information.
- From
the menus, choose:
- In the table builder, drag and drop Age category from the variable list to the Rows area on the canvas pane.
- Right-click Age category on the canvas pane and choose Summary Statistics from the pop-up menu.
- In the Summary Statistics dialog box, select Column N % in the Statistics list and click the arrow to add it to the Display list.
- In the Label cell in the Display list, delete the default label and type Percent.
- Click Apply to Selection.
- Right-click Age category on the canvas pane and choose Categories and Totals from the pop-up menu.
- Select (click) Total in the Categories and Totals dialog box.
- Click Apply and then click OK in the table builder to create the table.