
Cyber Resilient Organization Study 2021
Executive summary
The sixth annual Cyber Resilient Organization Study from IBM Security™ is based on research from the Ponemon Institute’s survey of more than 3,600 IT and security professionals around the world in July 2021.
This global study tracks the ability of organizations to achieve a strong cyber resilience security posture. In the context of the research, a cyber resilient enterprise is one that can prevent, detect, contain and recover from a myriad of serious threats against data, applications and IT infrastructure.
This year’s study examines the approaches organizations took to improve their overall cyber resilience. It details the importance of cyber resilience to minimize business disruption in the face of cyberattacks as part of a strong security posture.
New this year are a closer look at the impact of ransomware and the adoption of approaches such as zero trust and extended detection and response (XDR). Finally, we offer recommendations to help your organization become more cyber resilient.
Study highlights
51%of respondents reported a significant data breach1
61%of organizations paid a ransom on a ransomware attack2
74%of organizations reported inconsistently applying their CSIRP3
What’s new this year


The organizations surveyed represent 15 industries plus a small subset of “other” categorizations, as shown in Figure 1.
Primary industry classification of survey respondents

Figure 2 indicates the geographical regions represented by respondents, including several nations in North America, South America, Europe, Asia and Australia.
Survey response rate among geographies
| Survey response | Total sampling frame | Final sample | Response rate |
|---|---|---|---|
| United States | 16,010 | 577 | 3.6% |
| India | 12,050 | 408 | 3.4% |
| Germany | 11,500 | 346 | 3.0% |
| United Kingdom | 10,501 | 400 | 3.8% |
| Brazil | 10,090 | 370 | 3.7% |
| Japan | 9,801 | 327 | 3.3% |
| France | 8,356 | 304 | 3.6% |
| Australia | 7,750 | 261 | 3.4% |
| Canada | 6,330 | 257 | 4.1% |
| Asia | 5,607 | 162 | 2.9% |
| Middle East | 5,203 | 210 | 4.0% |
| Total | 103,198 | 3,622 | 3.5% |
Several factors led to findings that indicate significant changes in and challenges for surveyed organizations in 2021. Let’s go more in-depth to cover these issues.
Threat volume and severity keep increasing
Both the volume and severity of cybersecurity incidents increased or significantly increased in the past 12 months, according to 67% of respondents.
Of the respondents surveyed, 51% sustained a data breach over the last 12 months and 46% experienced at least one ransomware attack over the past two years.
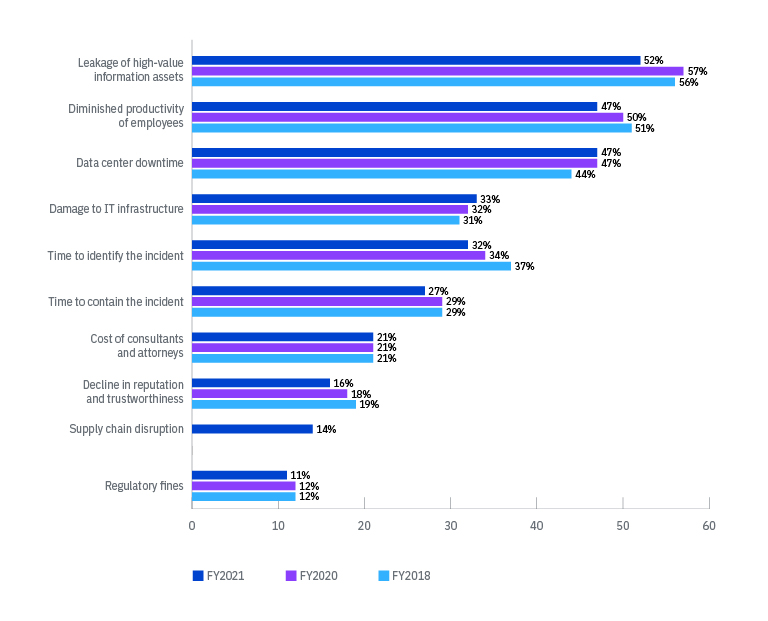
Figure 3 indicates how respondents reporting an increase or significant increase in the severity of cybersecurity incidents measured that designation.

How organizations measured the increase in severity of incidents
More than one response permitted
Ransomware and how much it costs organizations
The proliferation of ransomware is a troubling concern. Consider the following claims by respondents:
- Only 51% reported that their organizations had a specific response plan for ransomware
- 46% reported that their organizations had one or more ransomware attacks in the last two years
Of those organizations that sustained at least one such attack, the ransomware was unleashed by phishing or social engineering for 45% of the events, insecure or spoofed websites in 22%, social media in 19%, and malvertisements in 13%. The implication of these figures is enormous considering the next statistic.
61%Percentage of organizations that have had a ransomware attack in the last two years and paid the ransom
One publicized ransom payment made in 2021 involved a large U.S. refined products pipeline system. DarkSide ransomware reportedly only encrypted files on the pipeline’s IT networks. However, the attack had the potential to spread to the operational technology (OT) network. The company made the decision to shut down the OT network as a precaution, leading the attack to have an operational impact and ripple effects throughout the oil and gasoline supply chain.
Members of the DarkSide group claimed the motivation for the attack was purely financial. “Our goal is to make money, and not creating problems for society,” DarkSide wrote in a social media post. The attacked organization paid DarkSide USD 4.4 million in one day after learning about the attack. The far-reaching financial impact of the ransomware attack for the organization extended to a class-action lawsuit from gas stations claiming lost business from the network shutdown.
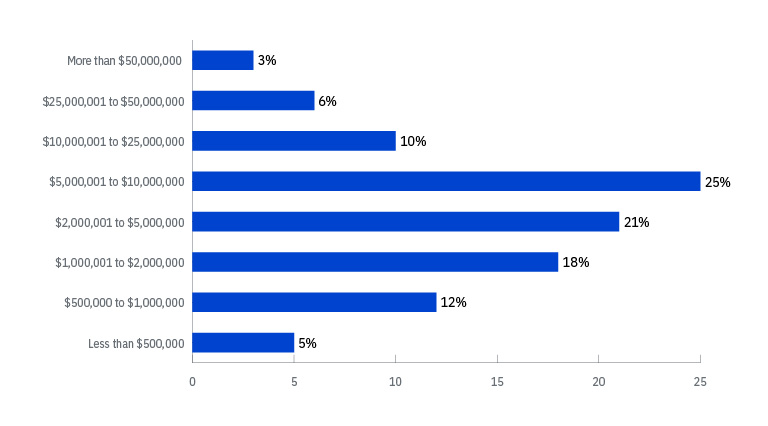
The demand by DarkSide was typical for ransomware threat actors. Figure 4 indicates that 83% of organizations that experienced a ransomware attack in the last two years had threat actors demand a ransom of over USD 1 million. For 25% of these organizations that experienced a ransomware attack in the last two years, threat actors demanded a ransom ranging from USD 5 million to USD 10 million.
Cost severity of ransom demands
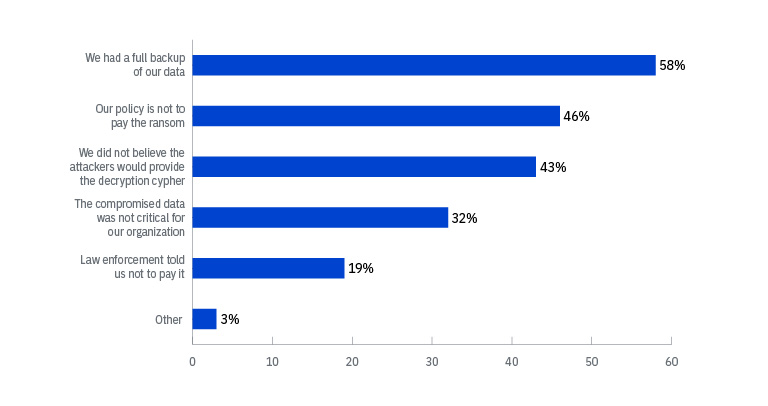
Among those 61% of respondents for organizations that paid the ransom, 60% said they did so because of the threat of data leakage. Figure 5 shows the reasons given as to why the remaining 40% of organizations didn’t pay the ransom demanded.
Why organizations infected by ransomware refused to pay a ransom
More than one response permitted
Supply chain attacks and disaster recovery
Figure 6 shows the top types of attacks for which organizations have response plans for distributed denial-of-service or DDoS (65%), malware (57%) and phishing (51%).
Types of attacks for which organizations have incident response plans
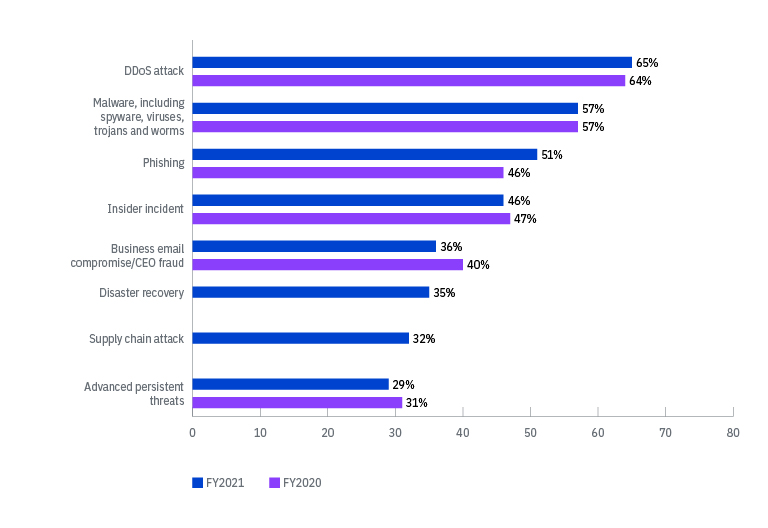
Only 46% of respondents said their organizations had specific incident response plans for at least one of the eight types of cyberattacks listed in Figure 6. Among those organizations:
- Only 32% of those surveyed said their organizations have a plan for supply chain attacks
- Only 35% said their organizations have a plan for disaster recovery
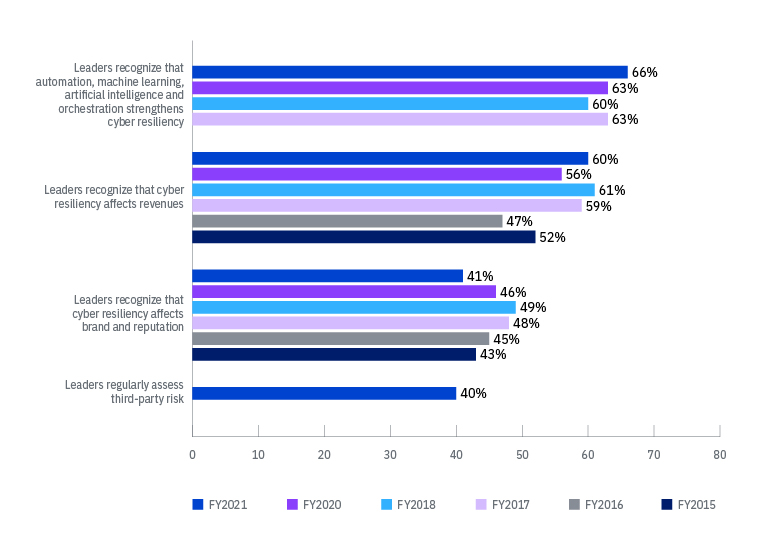
- Only 40% of organizations’ leaders regularly assess third-party risk
One reason for these figures could be that many organizations have a low level of cybersecurity maturity. The following section indicates the extent of this issue.
Cybersecurity maturity stalls as threats rise
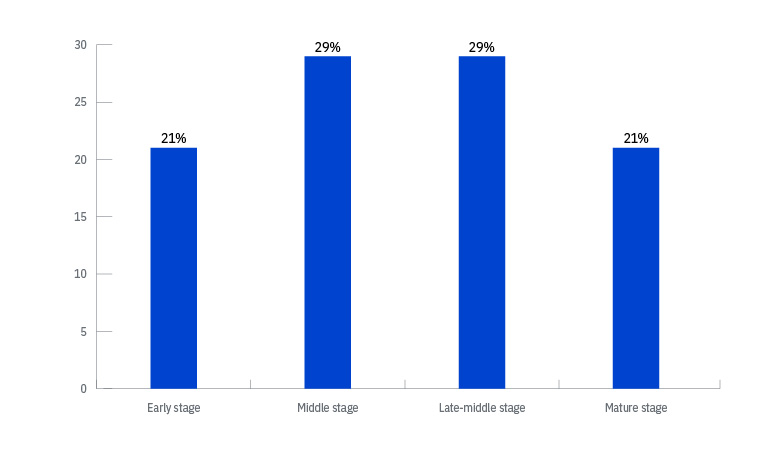
As 58% of organizations remain at middle or late-middle maturity for cyber resilience, others take advantage of opportunities for improvement.
Asked to describe the maturity level of their organization’s cyber resiliency program, respondents gave the following breakdown, as shown in Figure 7. Only 21% reported their organizations were mature, meaning all planned and defined cyber resiliency security activities are deployed, maintained and/or refined across the organization.

How organizations describe their cybersecurity maturity levels
Only 26% of organizations have a cybersecurity incident response plan, or CSIRP, that’s applied consistently across the entire enterprise, a figure that has remained low over the years. Figure 8 shows that the frequency of reviewing and testing CSIRPs is once a year for 35% of those surveyed or without a set time period for 40% of those surveyed.
How often organizations with CSIRPs test their plans

Over time, respondents continue to report that there is more time involved in the whole process to detect, investigate, contain and respond to a cyber incident. For example, in 2021, 58% said the time from detection to response for their organizations had increased—the same percentage as reported in 2020.
Indeed, general trends show few notable shifts in cyber resilience between 2020 and 2021—possibly due to overextended security teams because of the COVID-19 pandemic. However, as in our previous two reports, we have isolated the most cyber resilient organizations, which we designate as “high performers,” and uncovered their differentiators with the other organizations surveyed.
Let’s examine some of what the 833 high performer respondents are doing and provide insights to inspire improvements among stalled organizations.
Steps high performers are taking to improve cyber resiliency
When asked to rate their organizations’ cyber resiliency on a scale of 1 to 10, 23% of respondents rated themselves as 9 or 10. This subset of respondents are referred to as “high performers.” High performers identified the following top investments for their improvement:
- 65% reported the ability to have visibility into applications and data assets
- 62% reported the use of automation, AI and machine learning
- 45% reported secure migration to the cloud
- 39% reported timely assessment of vulnerabilities and application of patches
Strategies for improvement emphasized among high performers were assessment and remediation of third-party risks (88%), ability to hire and retain skilled IT security staff (86%), training and certification for cybersecurity staff (84%) and training for end users on the protection of sensitive and confidential information (79%).
The following other practices distinguish high performers from the overall average:
- 50% of high performers apply CSIRPs across the enterprise, compared to 26% of all respondents
- 40% of high performers are mature, compared to 21% of all respondents
- 56% of high performers test incident response plans in a cyber range, compared to 37% of all respondents
- 71% of high performers have an incident response plan for a ransomware attack, compared to 51% of all respondents
Prevention and reduced complexity can help
Despite previously cited differences with high performers, most respondents noted their organizations invested in some cyber resiliency improvements. Some respondents also noted why cyber resiliency didn’t improve for their organizations.
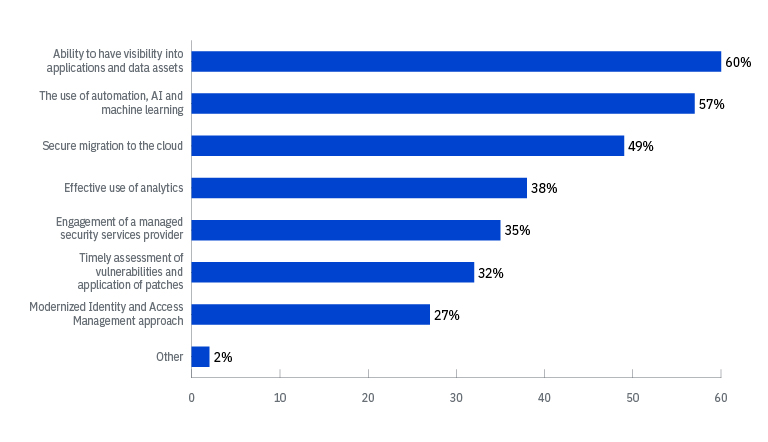
Although maturity levels appear stagnant, most respondents surveyed believed their organizations’ cyber resiliency had significantly improved (24%), improved (27%) or somewhat improved (23%) over the last two years. Figure 9 indicates what respondents believed were the top investments to have a significant improvement in cyber resiliency for their organizations.

Investments that led to significant improvement in cyber resiliency
Three responses permitted
Reasons for no cyber resiliency improvements
As shown in Figure 10, the most frequently cited responses for why cyber resiliency hasn’t improved were an inability to reduce silo and turf issues (69%), fragmented IT and security infrastructure (65%), lack of visibility into applications and data assets (60%) and delay in patching vulnerabilities (59%).
Reasons why cyber resiliency hasn’t improved
More than one response permitted
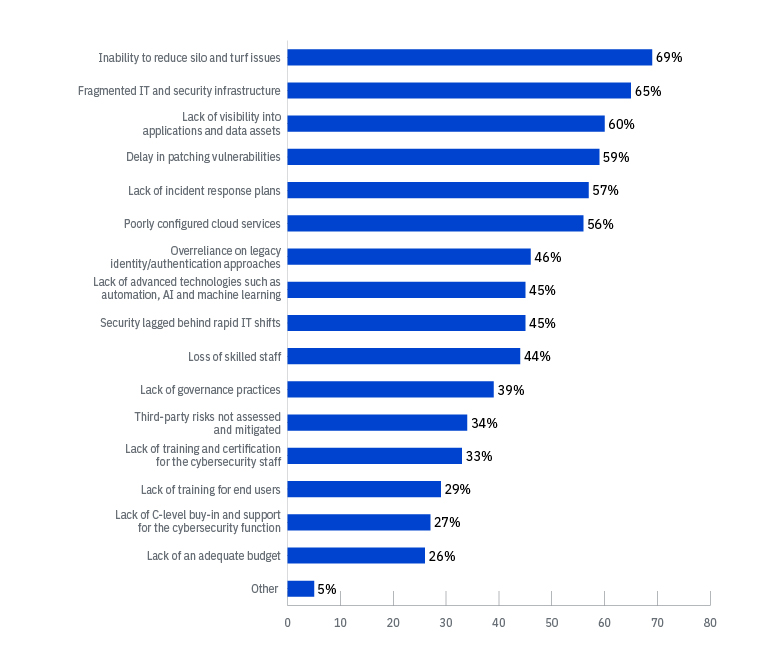
Figure 11 shows that multiple tools are a factor in cyber resiliency, as 30% of respondents said their organizations deploy more than 50 tools and technologies for security.
How many separate security tools and technologies organizations deploy today
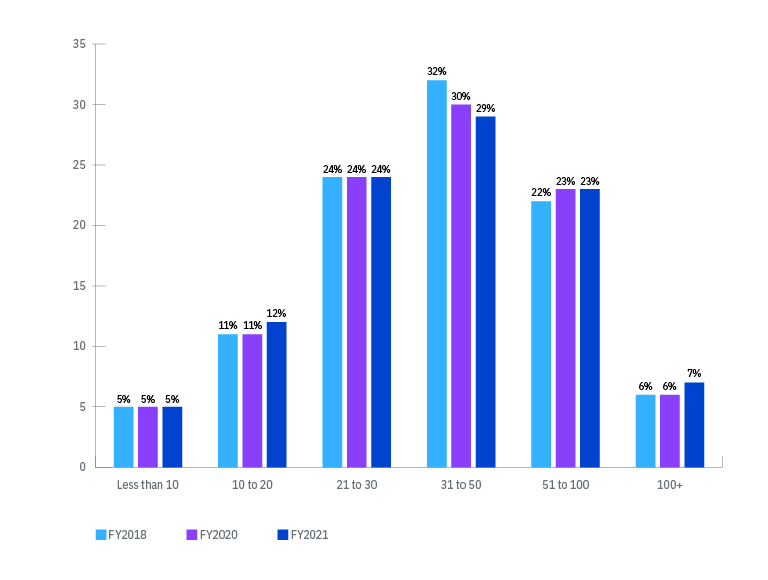
Figure 12 shows how many tools respondents said their security teams use to investigate and respond to a typical security incident. Among respondents, 45% used more than 20 tools when specifically investigating and responding to a cybersecurity incident.
How many tools security teams use to investigate and respond to a typical security incident
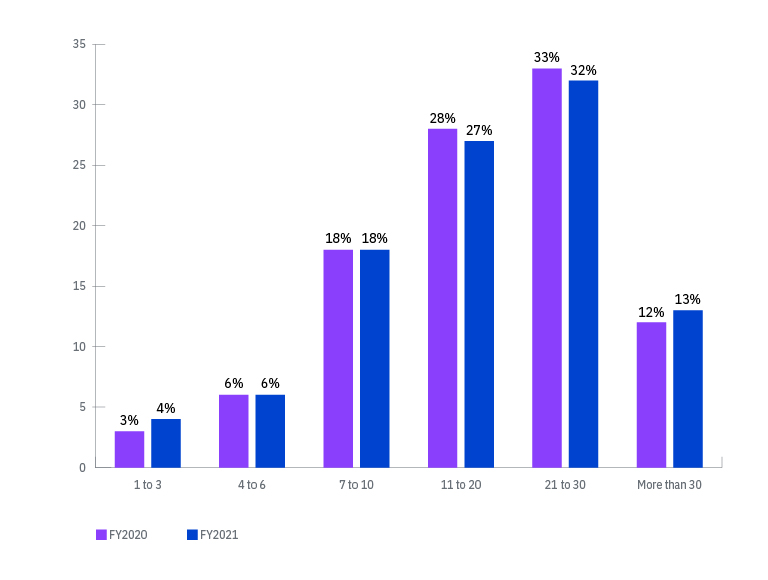
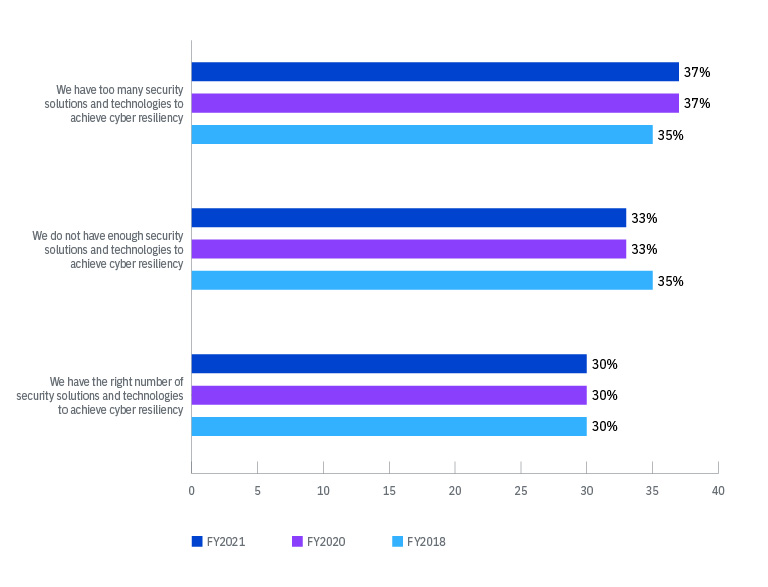
Figure 13 shows that only 30% of respondents said their organizations have the right mix of security tools.
How respondents view the number of separate security tools deployed by their organization
Putting best practices in place
Respondents cited the following approaches as making a substantial difference for their cyber resiliency.

Zero trust security
For 35% of respondents, their organizations have adopted a zero trust security approach. Of that group, 65% agreed zero trust security strengthens cyber resiliency.
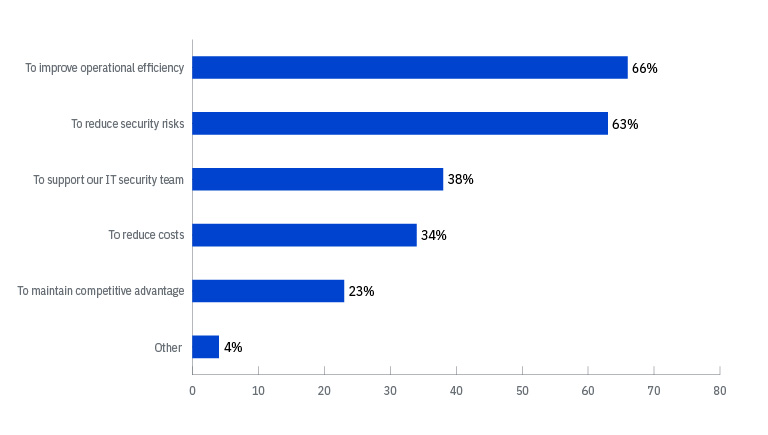
Figure 14 shows that respondents who said their organizations’ use of a zero trust security approach is significant or moderate cited their top reason as improving operational efficiency (66%).
Reasons why organizations apply significant or moderate use of a zero trust strategy
More than one response permitted
Additionally, 67% of high performers pointed to implementation of a zero trust strategy as a practice that improved cyber resiliency, compared to 54% of general respondents.
XDR
Among those surveyed, 31% of organizations have adopted XDR, and 76% agree that adopting XDR has strengthened their organization’s cyber resiliency.
Cloud security
Most respondents (87%) reported their organizations made significant use of the cloud. Secure migration to the cloud improved resiliency for 49% of respondents. On the flip side, poorly configured cloud services was a reason why cyber resilience didn’t improve or declined for 56% of respondents.
AI and automation
For 66% of respondents, their leaders recognize that automation, machine learning, AI and orchestration strengthen cyber resiliency. Additionally, 68% of respondents scored high (7-10) on the value of automation.
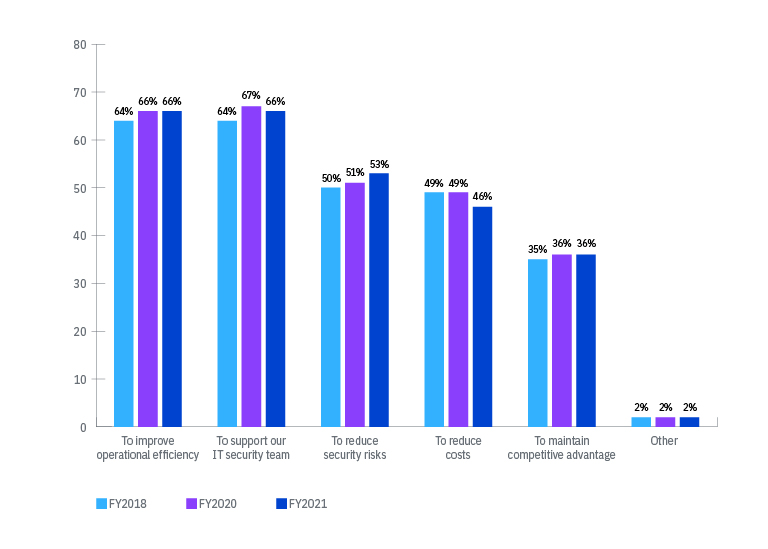
For respondents who said their organizations’ use of automation is significant or moderate, Figure 15 shows top reasons why.
Reasons why organizations apply significant or moderate use of automation
More than one response permitted
Incident response plans
Organizations with specific incident response plans tailored to attack types grew to 46% of respondents in 2021 compared to 40% in 2020. In addition, regular updating and review of incident response plans helped 38% of respondents improve their organization’s cyber resiliency.
Security professionals with organizations that lack some or any of these best practices might wonder about next steps for adoption. Recommended guidelines for adding these approaches appear in the following section.
How to adopt these practices incrementally
Consider implementation of approaches that can strengthen an organization’s cyber resiliency.
Many respondents of the survey agree about the importance of cyber resiliency for their organization and other enterprises. Figure 16 shows the percentage of respondents who noted that adding best practices like AI and automation can also make a difference for an organization.

How leaders view practices that impact cyber resiliency
Strongly agree and Agree responses combined
The following suggestions may help organizations install best practices based on discoveries from this study. Additional solutions not covered in this study might help organizations regardless of their stage of maturity for cyber resiliency.
Establish a maturity matrix
Organizations should take their first steps based on their individual levels of maturity and priority use cases for their business. They should align their risks to the specific offerings previously mentioned by respondents as best practices—XDR, cloud security, zero trust, AI and automation and incident response.
With this matrix in place, security officials can then prioritize which approaches to implement and in which order that best meets their organization’s needs.
Adopt practices that mitigate severity and improve cyber resilience
Here are the top recommendations to help your organization become more cyber resilient. The findings from respondents in this survey explain why they’re worth your consideration.
- Create incident response plans—and test them: Regular updating and review of incident response plans was a reason why cyber resiliency improved for 47% of high performers. Improve incident response preparedness by developing both enterprise-wide CSIRPs and threat-specific incident response plans. Practice them regularly.
- Protect your critical databases: Leakage of high-value information assets was a measure of severity for 52% of respondents. A comprehensive data security strategy can help organizations reduce data risk and respond to threats.
- Keep systems running with advanced protection from cyberthreats: Data center downtime was a measure of severity for 47% of respondents. Proactively manage threats and avoid system downtime with a zero trust approach.
- Speed up analysis with AI and threat intelligence so that you can give time back to analysts: Diminished productivity of employees was a measure of severity for 47% of respondents. XDR solutions can provide more advanced analytics and automated workflows that give teams time back to investigate and hunt for threats.
- Break down silos and increase visibility: Inability to reduce silos (87%) and lack of visibility into applications and data assets (74%) were the top two impediments to improving high performers’ cyber resiliency. An open platform that fosters integrations between technology can help unite disjointed processes and data and provide broad visibility.
- Implement a patch management strategy: Delay in patching vulnerabilities (59%) was a reason cited by average respondents as to why their organization’s cyber resilience didn’t improve. A vulnerability management program can help cybersecurity teams proactively identify, prioritize and remediate the vulnerabilities that threaten to expose critical assets.
- Percentage of organizations whose respondents reported a data breach involving the loss or theft of more than 1,000 records containing sensitive or confidential customer or business information in the past 12 months.
- Percentage of organizations reporting a ransomware attack in the past two years whose respondents said they paid the ransom.
- Percentage of organizations whose respondents said they don’t have a cybersecurity incident response plan (CSIRP) that’s applied consistently across the enterprise.