Documentation for the Pro features of IBM Support Insights' Case metrics
Obtaining Pro features
If you wish to gain access to IBM Support Insights Pro features, please go to this page for details on the different options to do so.
Case analysis
The Case analysis tab of the application's Case metrics page provides you with a deep dive into your support experience. On this page, you can see a detailed break-down of open, created and closed/canceled support requests - by severity, case type, product family, etc.
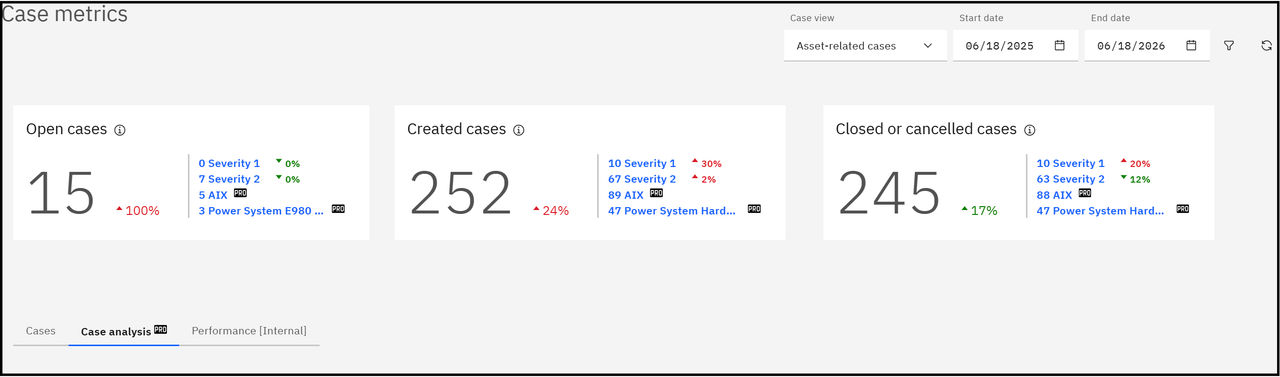
At the start of the page, you have the default standard case metrics elements - the case view dropdown, date selector, filters, and widgets.
On the far right-hand side of the Case analysis view itself (starting after the default elements), you will see two dropdowns - Product and Top5 - these are the default values for the fields. The first one determines the grouping criterion for the entire tab (Product, Product family, Case country, etc). Whereas using the second one, you can select if you wish to see the Top 5, Top 10, Top 20 or All items' case metrics displayed on the page. For example, if you have chosen 'Case country' in the first dropdown, and 'Top 5' in the second dropdown - you will see the support requests grouped by country, and the 5 countries with the most support requests will be displayed.
Please note, your choices in the dropdown selectors will be reflected on all the views of the tab when you switch between them. If you wish to see one sub-tab grouped one way and the second grouped a different one - you would need to manually switch your selection in the aforementioned dropdowns.
Lastly, if there are less than five elements in your selected grouping criteria - you will see less than five entries in the groups summary data table outlined in the following section of this page.
Components
When you open the Case analysis tab, you will see the Open cases section by default. You can switch between viewing them or the Created cases or the Closed or canceledcases. Please note, open cases refers to cases in open status at the given moment, whereas created cases refers to cases which were created during the specified time-frame (using the calendar selector at the start of the page). The cases in the closed or canceled group are those which were resolved - either by closure or cancelation - during the specified time period.
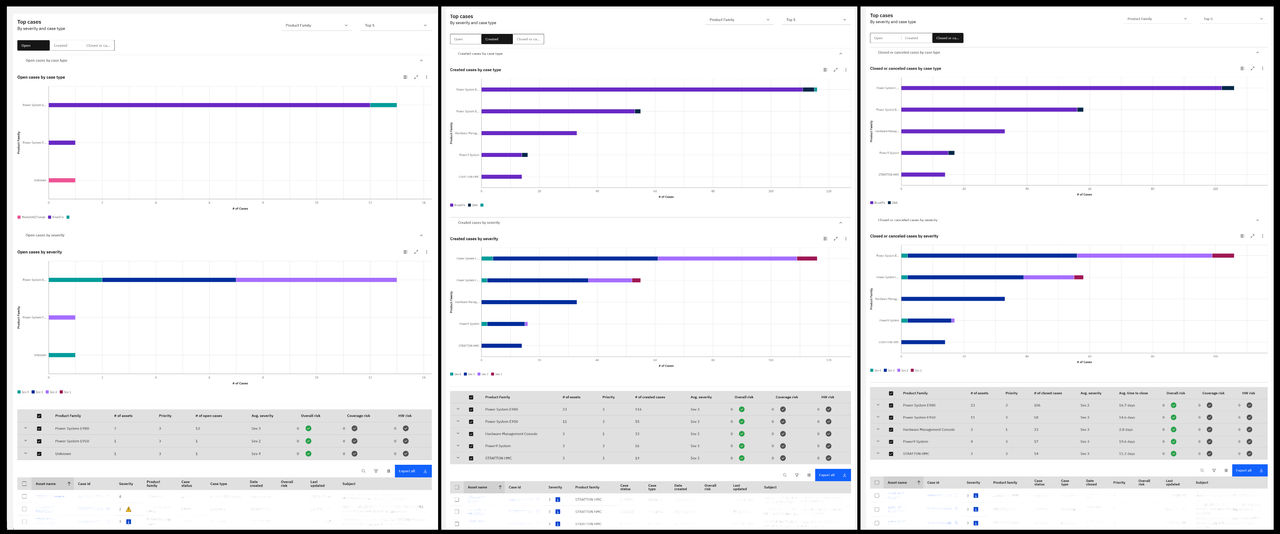
The first graph on the page is the Cases by case type graph, which provides a breakdown of support requests by case type. The number of cases is listed on the X axis, and the chosen grouping criterion is listed on the Y axis. The graph provides a breakdown of the included support requests by case type, including Break/fix, Installation, and others.
Immediately after is the Cases by severity graph. It displays the number of support cases on its X axis, and the selected grouping criterion on the Y axis. The graph provides a breakdown of the available included support requests, by selected criterion, allowing users to better understand the distribution of their top support requests by severity.
Both graphs can be collapsed to focus only on the data in the second half on the page. This is accomplished by clicking on the upwards facing arrow located on the far right-hand side of each of the graphs' names.
Additionally, on the right-hand side of both graphs, you will see three button icons. The first one will show you the graph's contents in a table format as a pop-up on the page, where you can also opt to download the displayed table in .csv format by clicking on the respective shown button. The second icon button will open the graph in full-screen mode on your screen. And the third icon button contains all available download formats for the graphs - .csv ; .png or .jpg format. If you choose to export the graphs' contents in the form of a .csv file, the download will contain the data that is visualized in the graph. If you opt to download the graphs in either of the two image formats, you will download an image with the graph as you see it in the application's interface.
Following the graphs, a table contains summary data for the top groups, including count of assets, number of open cases and average case severity. The rows of the table are expanded by clicking the arrow at the left-hand side of each respective row. In the expanded view, you can see a more detailed break-down by case severity, including the number of assets that have support cases of that severity and the number of cases for each severity.
The Case history table is located at the end of the page and contains details of the cases for the selected criteria.
Top Open cases
When viewing the Open cases sub-tab of the page, the calendar selector, located on the top right-hand side of the screen is disabled, as the page contains only the currently open support cases.
The first graph on the page is the Open cases by case type graph, which provides a breakdown of support requests by case type. The number of cases is listed on the X axis, and the chosen grouping criterion is listed on the Y axis. The graph provides a breakdown of the open support requests by case type, including Break/fix, Installation, and others.
Immediately after is the Open cases by severity graph. It displays the number of support cases on its X axis, and the selected grouping criterion on the Y axis. The graph provides a breakdown of the available open support requests, by selected criterion, allowing users better understand the distribution of their top support requests by severity.
The Case history table is located at the end of the page and contains details of the cases for the selected criteria.
Top Created cases
When viewing the Created cases sub-tab of the page, the calendar selector, located on the top right-hand side of the screen, is enabled in this view. You can select a specific time-frame for which to view cases, and apply filters to focus the content based on age created-to-closed and severity. If you wish to revert the view back to its default state, you can click on the Reset button, located in the far right-hand side of the page.
The first graph on the page is the Created cases by case type graph, which provides a breakdown of support requests by case type. The number of cases is listed on the X axis, and the chosen grouping criterion is listed on the Y axis. The graph provides a breakdown of the created support requests by case type, including Break/fix, Installation, and others.
Immediately after is the Created cases by severity graph. It displays the number of support cases on its X axis, and the selected grouping criterion on the Y axis. The graph provides a breakdown of the available created support requests, by selected criterion, allowing users better understand the distribution of their top support requests by severity.
Top Closed or canceled cases
When viewing the Closed or canceled cases sub-tab of the page, the calendar selector, located on the top right-hand side of the screen, is enabled in this view. You can select a specific time-frame for which to view cases, and apply filters to focus the content based on age created-to-closed and severity. If you wish to revert the view back to its default state, you can click on the Reset button, located in the far right-hand side of the page.
The first graph is the Closed cases by case type graph. Like the Case analysis - Open view, the number of cases is listed on the X axis and the chosen grouping criterion is listed on the Y axis. This graph allows you to get a better overview of the nature of your top closed support requests.
The second graph is Closed cases by severity, which displays the number of cases on its X axis, and the selected grouping criterion on the Y axis. The graph provides insights into the severity distribution of the client's closed support requests, grouped according to the selected criterion.