Task 6: Monitoring
You monitor a running ruleset by using the Rule Execution Server console. You use Decision Warehouse to audit and view stored decision traces.
About this task
As an IT professional responsible for computer applications at your company, you must ensure that your rule-enabled applications are running correctly. In addition to providing an environment for managing the execution of your rules, Rule Execution Server can be used to monitor the execution of your rulesets.
Auditors can analyze the execution performance of rulesets, and troubleshoot any problems. To identify a problem when a transaction fails, auditors and analysts need to know the business policies that were applied, and the data that was used at execution time. Accessible from Rule Execution Server, Decision Warehouse stores ruleset execution traces that can be used for auditing purposes.
![]() This task takes 10-15 minutes to complete.
This task takes 10-15 minutes to complete.
Step 1: Running Rule Execution Server diagnostics
About this task
You run the Rule Execution Server diagnostics to identify errors in the execution environment.
Procedure
Step 2: Viewing statistics on deployed RuleApps
About this task
When the execution environment is functioning correctly but performance problems are being reported, you can consult statistics from the Rule Execution Server console.
Procedure
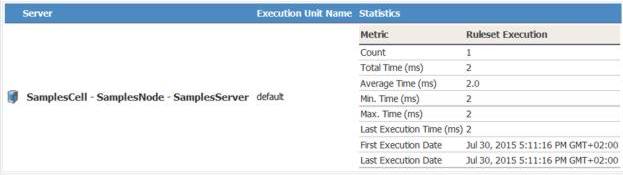
- Click View Statistics in the Ruleset View toolbar
to see ruleset execution statistics such as how many times the ruleset is run, and runtime
statistics such as average time and maximum time.
You can see the results in the Ruleset Execution column. The Task Execution column is not available. The view shows statistics for the selected mode, either Ruleset Execution or Task Execution.
Step 3: Running a transaction in the Miniloan application
About this task
In the previous task, you added the monitoring.enabled ruleset property to keep a trace of the decision history. Every transaction that you simulate for the ruleset is now stored and logged in Decision Warehouse.
Procedure
- Ensure that the Miniloan application is started. In a browser, enter the following URL with the correct port number: http://localhost:<PORT>/miniloan-server.
- Change the amount of the loan to 2000000.
- Select the Use Rules check box, and click Validate Loan. The loan is rejected.
Step 4: Searching for past transactions in Decision Warehouse
About this task
You search for past transactions and decision traces in Decision Warehouse to find the decision that caused the failed transaction.
Procedure
- On the Search Decisions page, leave
the fields blank, and click Search.
Decision Warehouse displays the decisions for the transactions that you ran in the Miniloan application. It shows the transaction from Step 3: Running a transaction in the Miniloan application, including the date and the processing time, and that one rule was run.

Step 5: Viewing the run rules
About this task
You can use Decision Warehouse to determine why the loan is rejected. You check the execution details for a decision and view the rules that were run.
Procedure
- In Decision Trace, expand .
The decision trace shows that the rule validation.maximum amount was run.
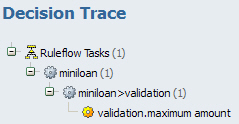
The loan was rejected because the amount that was entered in Step 3: Running a transaction in the Miniloan application exceeded the maximum amount of 1000000.
Results
You monitored the performance of rulesets and traced transactions. In the next task, you publish the rule project to Decision Center to make the rules accessible to business users in a shared web-based environment.