Reporting on data in configurations with Report Builder
If you use local or global configurations, you can use Report Builder and Lifecycle Query Engine (LQE) to report on the data in the configurations, or on configurations themselves.
You can also report on global and local components. For example, list the configurations in the components of a project, or search by tags to see which components are part of a specific release.
Before you begin
Reporting on data in configurations is available, but with limitations. For more information, see Getting started with reporting by using Lifecycle Query Engine data sources on Jazz.net.
About this task
- You must use an LQE data source.
- Lifecycle Query Engine: For reporting on components and configurations themselves. Example: Report across all components and configurations in a configuration-enabled project area, as in these scenarios:
- Show all the components of a Car project.
- Show all the streams of the Engine component in the Car project.
- Show the artifacts (for example, test plans) in a stream of the Engine component.
If your report contains Artifact A in the results, and different configurations in the project area have different versions of Artifact A, your report contains information about all the versions.
- Lifecycle Query Engine scoped by
a configuration: For reporting on a specific global configuration, or on local
configurations that are not in a global configuration. When you run the report, you must choose a
configuration. Choosing a component is not mandatory. If you have a versioned type system, such as
for IBM Engineering Requirements Management
DOORS® Next (DOORS Next), see
Reporting on applications that have versioned type systems.Example: Report on artifacts in multiple projects in the same domain, such as showing all incomplete test cases assigned to you.
- Lifecycle Query Engine: For reporting on components and configurations themselves.
- Report Builder reports with the data source selected as Data warehouse do not contain information for the projects that are enabled for configuration management.
- BIRT-based reports are no longer available for the projects that are enabled for configuration management.
 icon.
icon.Procedure
What to do next
- To see your report in the list of other reports, click All Reports or My Reports.
- To further edit your report, click a pencil in the My Choices pane at the right. Click Save to save your changes.
- You can export your report to various document types (Microsoft Word, PDF, HTML). To do further editing on the report, export it to IBM Engineering Lifecycle Optimization - Publishing if you have a license. You can also export a report graph to an image file. See the related topics.
Step 1. Choose data
Procedure
-
Choose a report type.
- Click the pencil
 icon to select the LQE
data source depending on what you want to report on: a specific configuration
or all configurations. If only one data source is defined, it is selected by default. To decide what
data source to choose, read this topic.
icon to select the LQE
data source depending on what you want to report on: a specific configuration
or all configurations. If only one data source is defined, it is selected by default. To decide what
data source to choose, read this topic. - Select Current Data (table or graph) to report on the latest information about artifacts in and across projects.
- Click the pencil
-
Trace relationships and add artifacts.
Explore how your artifacts are linked to other artifacts from the same, or from other lifecycle tools. Click Add a relationship. For each artifact type, you see all the existing relationships. Pick one, and click OK.Note: Some custom link types are not shown in the list of existing relationships: for example, custom link types from artifacts that do not own the link. To know more, contact your administrator, or see Getting started with reporting by using Lifecycle Query Engine data sources on Jazz.net.You can select multiple relationships between two artifacts of the same type, as shown in the following example:
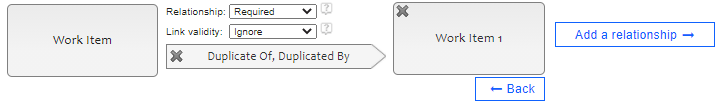 Example: To show that a requirement is validated by a test case, click Add a relationship, and under QM Test Case, select the Validated by relationship. To also list the work items that are associated with the test cases, click , and then click OK. To specify what type of related work item to add, select Work Item, and click OK. In the Set conditions section, you can further define the relationships.
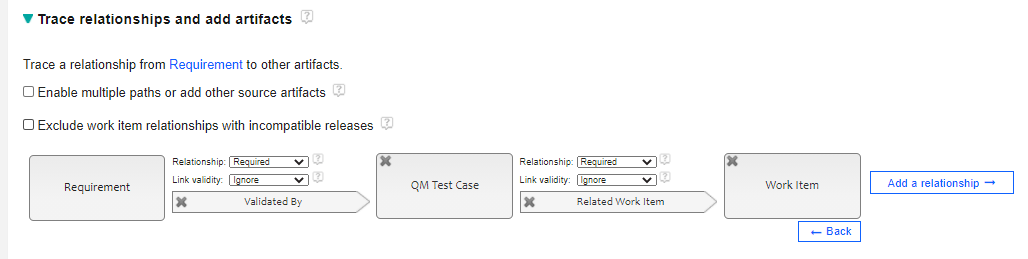 Tip: When you name and share your report, include the traceability link names so that team members can find your report easily.To trace multiple relationships from one artifact, or to add source artifacts, select the Enable multiple paths or add other source artifacts checkbox.
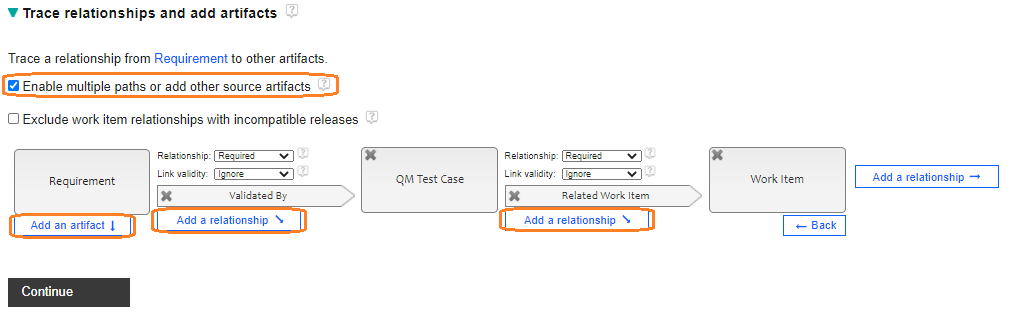
- From one artifact, you can trace multiple relationships to other artifacts, and show all the
results in the same report. Choose how to for combine the results:
- Merge
- The results are shown in the same rows.
- Append
- The report shows the results for each traceability relationship. All the source artifacts are in the same column.
- Append in new columns
- To count the source artifact relationships separately, append the results in different columns.
- Click Add an artifact, and select an artifact type.
Example: You can trace how features are linked to work items, test cases, and child requirements. You see all the relationships in a single table.To trace release-specific relationships between work items and versioned artifacts, select the Exclude work item relationships with incompatible releases checkbox.
If you choose to select this option, Report Builder includes the work item relationships only if one or both of the following statements are true:- Relationships are not associated with any IBM Engineering Workflow Management (EWM) releases.
- The relationships are associated with at least one EWM release that is linked directly to the global configuration, or through a recursive release predecessor of the global configuration that is used to run the report.
If you choose not to select this option, Report Builder might include relationships that do not apply to the configuration that is selected for the report, and such mismatches might not be shown in IBM Engineering Requirements Management DOORS Next (DOORS Next) or IBM Engineering Test Management (ETM) application. You can control whether to see such mismatches in the specific application by setting the Exclude work item relationships with incompatible releases advanced server property.
You can also select this option to exclude the work item relationships for incompatible releases and make Report Builder consistent with the incoming links from work items to requirements in DOORS Next, and test artifacts in ETM provided the corresponding application has the Exclude work item relationships with incompatible releases advanced server property enabled. This property is set to
trueby default, but you can configure it. For more information, see Enabling filtering of work item relationships with incompatible releases.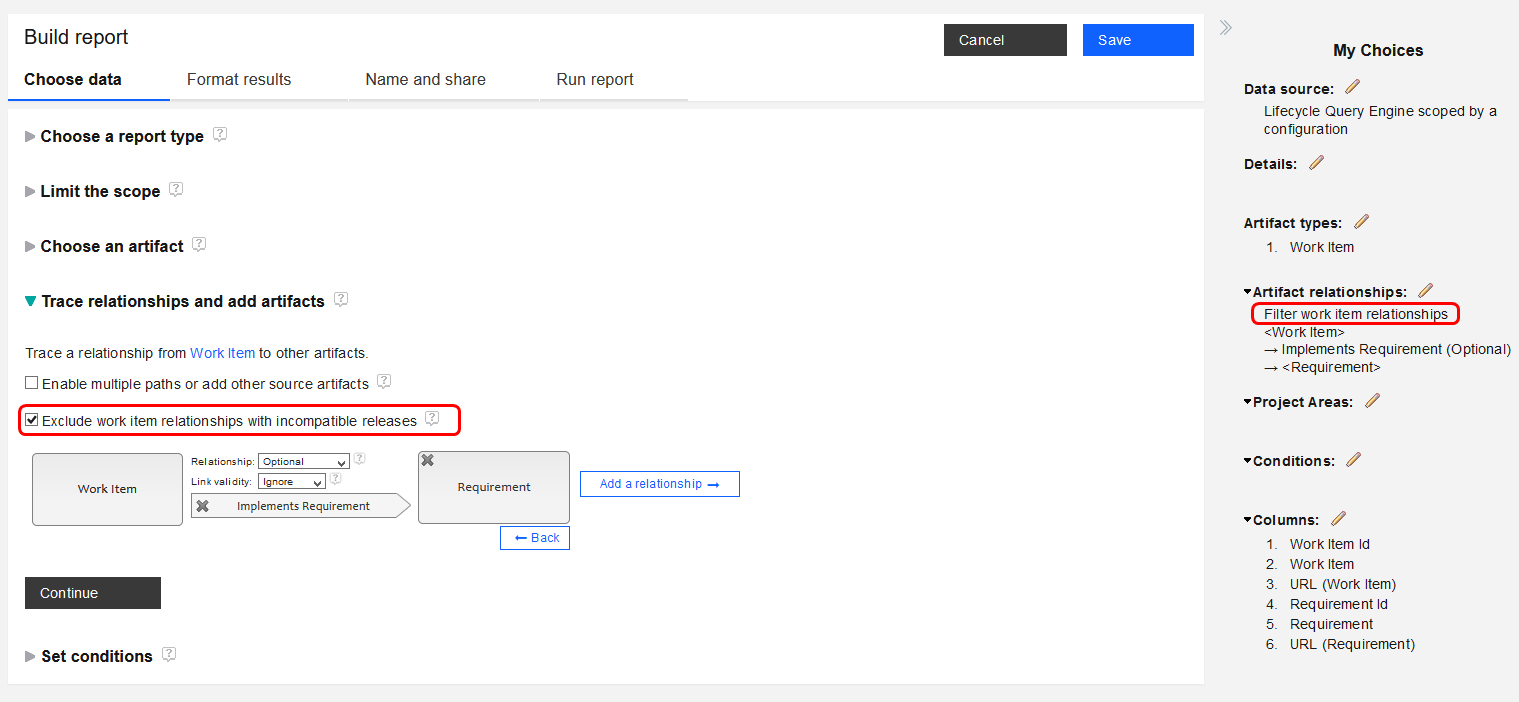
To remove the last relationship from the right of an artifact, click Back. To remove an artifact or relationship, and all the items to the right, click the X on the item name.
Tip: You can change the name of an artifact in the traceability box by double-clicking its name and typing the new one. For example, if you want your report to refer to related defects instead of change requests, double-click the Change Requests box in the traceability diagram, and type Defects. Changing the name in the traceability diagram makes it clearer to your team members, especially if your report uses custom artifact types or custom links.After you build the artifact relationships, click Continue.
- From one artifact, you can trace multiple relationships to other artifacts, and show all the
results in the same report. Choose how to for combine the results:
-
Set the conditions.
To further refine the content of your report, specify conditions. You can set conditions for any attribute of the artifact type that you selected, and any attribute of the related artifact types in your traceability paths. By setting conditions, you can further identify relationships among artifacts. For example, to show that a requirement is validated by a test case, select the Validated by relationship under QM Test Case. Then, set a condition to focus only on approved test cases. For the artifact type QM Test Case, choose the attribute State, and set the value to Approved.
You can set a condition to return data only for specific components. You must select an application-specific artifact type (such as QM Test Case, or System Requirement). These artifact types contain a Component attribute that you can choose, and then select the component to report on. The Component attribute is not available if you select a global artifact type (typically the expandable top-level artifact type in the Choose an artifact section) or types from projects that aren't enabled for configurations.Tip: If you add the Component attribute as a column but do not add a condition for it, when you run your report you can select a component to filter the results that you see.- Click Add condition.
- From the list, select an artifact type.
- Choose the attribute that you want to specify a condition for, and select the values to return the artifacts you want.
- To keep the window open for adding other conditions, click Add. Otherwise, click Add and Close.
- Optional:
Change the lock
 to control whether people can or must supply a value for the condition when they run the
report.
to control whether people can or must supply a value for the condition when they run the
report.
- To edit a condition, click the pencil icon.
- To create logical groups of conditions, select the conditions and click Group.
- To create nested groups of conditions, use the grouping options or drag conditions to existing groups.
- To exclude data from a report by grouping conditions, use the Not all match (AND NOT) or None match (OR NOT) options.
- To reorder conditions, drag them into position.
- To remove conditions, select them, and click Remove.
Note: If your condition uses an is not statement, the report shows only artifacts that have different values from the one you specified. If no value is selected for that attribute (the value is unassigned), the artifact is not included in the report.To include artifacts with different values from the specified one, and also artifacts with unassigned values, create two conditions and group them by using Some match (OR).
Example:If you group the conditions, you get the expected results, but the report takes longer to run. Sometimes several projects use the same custom attribute, and although the attribute has the same name across the projects, its ID is different in each project. To report on this attribute, add a condition for each project. Then, to consolidate them in your report, group the attributes by using an OR condition.Example: Each project that you report on has a risk status attribute, and it means the same to each project. Select this attribute for all the projects; then, group the attributes, and add an OR condition between them. To show the results in one column, instead of one column for each project, see the Show the report as a table section.Tip: To report on requirements in specific modules, from the attributes list, select the requirement or requirement type, and choose the Collection or Module attribute; then, choose the collections or modules, and click Save.
After you create your conditions, click Continue.
Step 2. Format results
Procedure
- Format the results to determine whether to show the report as a table or a graph.
- Click Refresh to see a sample layout of your report. To see all the data, you must run the report.
Step 2a. Show the report as a table
Your report already has some columns, including columns for the attributes you created conditions for.
Procedure
-
Add calculated value columns: Add columns that show calculations such as
averages, sums, or counts.
- Select the artifact type.
- Select the calculation to show.
- Select the attribute for your calculation.
- To add other calculated values, click Add. Otherwise, click Add and Close.
Example: To count the defects that were created in a specific time range, select . Then, set the time range.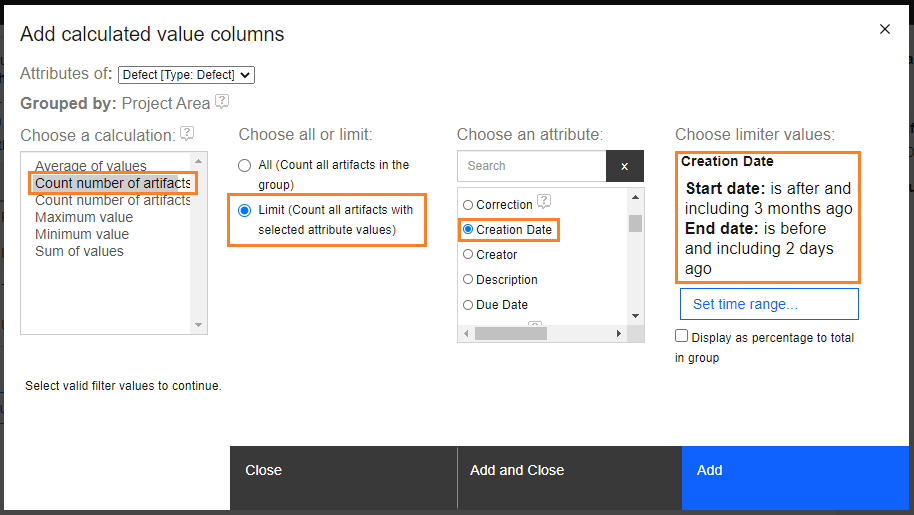
-
Add custom expression columns if you are a report manager, and if your
data source is configured to allow report managers to edit queries: To show the data in the form
that you need, you can use attributes and functions to build custom expressions.
-
Add attributes (and functions if needed) by selecting one and clicking the
Add
 button.
-
Add attributes (and functions if needed) by selecting one and clicking the
Add
-
Format columns.
- Change the column name: Type in the Column Label field.
- Arrange columns: Click the drag handle
 on the left of the column label, and drag it to another location, or use the controls in
the Actions column.
on the left of the column label, and drag it to another location, or use the controls in
the Actions column. - Adjust the column width: Click the column boundary in the table layout, and drag it into position.
- Sort columns: Select the sort method from the Sort Type list. You can sort more than one column. To change the sort order, edit the number.
- Color-code your report: Click in the Color section
to configure rules for highlighting specific data in your report. You can add multiple coloring
conditions. If several conditions target the same cells in your report, prioritize them:
- Within the same column: Drag a condition to adjust its priority. In a list, the priority increases from top to bottom. The first condition is met first. The last condition can override the first one, so it has the highest priority.
- Across all columns in your report: Use the Priority field to define the sequence to apply your conditions in. Enter a value from 1 (highest) to 9 (lowest). To give a condition the lowest priority, leave the Priority field empty.
- Combine consecutive columns: Enter the same column label for equivalent
attributes that are grouped in one condition. Using the risk status example from Set conditions, for each instance of the
attribute (Risk Status in RM, Risk Status in QM, and others), set the column label to
Risk Status. When you run the report, one Risk Status column shows data from
all the projects.Important: If the consecutive columns contain calculations, the labels are combined in the report that you export, but not on the Run report page.
- Remove columns: Use the controls in the Actions column.
Step 2b. Show the report as a graph
Report Builder picks the graph type based on your selections so far. Experiment to find the best graph type. Typically, line graphs convey trend information effectively, but you might find that a bar chart (stacked or grouped) works better with your data.
Procedure
Before you can preview a graph, you must select a value for the unit of measure. You can also select the dimension.
Step 3. Optimize the report
About this task
When you create a report, Report Builder generates the underlying query resource. If you are using Data Warehouse as the data source, an SQL query is generated. If you are using Lifecycle Query Engine, a SPARQL query is generated.
If you want to manually edit the generated query, see this topic. You can also generate alternate queries and optimize your reports based on your requirements.Procedure
Generate alternate queries by using the following options. To find what works best, try turning these options on and off. The options appear only when you select Lifecycle Query Engine or Lifecycle Query Engine scoped by a configuration as the data source.
- Select the Defer finding relationships with an alternative query checkbox to generate an alternate query that filters on source artifacts before finding relationships. Try this option if your data has one-to-many relationships in the Artifacts relationships section.
- Select the Defer scoping by projects with an alternative query checkbox to generate an alternate query that filters on artifacts first before scoping by projects. Try this option if your data has large number of projects in the 'Limit the scope section.
Step 4. Name and share the report
Procedure
Step 5. Run the report
About this task
You can use the dynamic Filters option to edit the configuration or conditions set for the report. When you clear dynamic filters, the default choices from the report, which include the conditions specified in the "Set conditions" section and the projects selected in the "Limit the scope" section, are retained.
To find out details about the logic behind the dynamic filters, read the topic Considerations for reporting on data in configurations.If you show the report as a table, you can add and
change filters on columns by clicking the pencil icon.
 icon with asterisk:
 - To change the filter values, click that icon.
- To see which filter values are applied, hover over the column name.
If Report Builder reports don’t show the artifacts that you expect, show artifacts more than once, or show a different number of artifacts than application views, ask an application administrator to validate the TRS feeds for the application. See Validating TRS feeds and the LQE index.
 along with hover text, if LQE conditions affected the execution time of
the report.
along with hover text, if LQE conditions affected the execution time of
the report.
Run the report with data completeness check enabled
You can use Data Completeness Check to verify whether a specific report has problems. The Data Completeness Check feature is applicable for reports that use Lifecycle Query Engine scoped by a configuration as the data source. Problems that might affect the report results include skipped resources, missing resources, or resources with failed patches. If your reports do not show the artifacts that you expect, show artifacts more than once, or show a different number of artifacts when compared with the application, perform a data completeness check.
Before you begin
The Data Completeness Check option is not available on the Run report page by default. If you want to use this option, contact your system administrator.
- Add the enable.lqe.data.completeness.check.feature property in the JTS_install_dir/server/conf/rs/app.properties file.
- Set the property value as true.
- Restart the Report Builder server.
Procedure
- Click the Settings icon
 on the upper right of the list box.
 - Select the Data Completeness Check option.
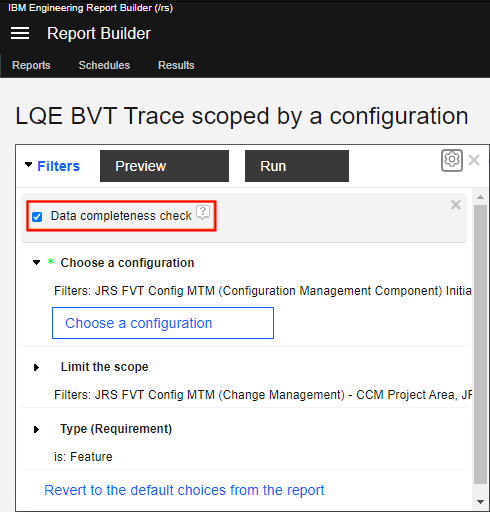
- Click Choose a configuration. In the "Choose a configuration"
dialog box, select the domain, project area, component, and configuration, and then click
Accept.
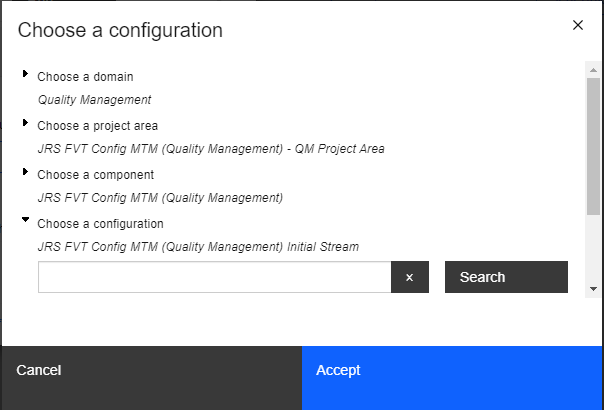 Note: The Data Completeness Check evaluates only the single configuration upon which the report is scoped.
 - Click Run to generate the report. The report displays information on skipped resources, missing resources, or resources with failed patches, if any.