Application - Application Performance Dashboard
Status Overview
- Depending on the composition of the selected application, the Status
Overview tab presents one or more perspectives for evaluating application status at a
high level:
- IBM® Website
Monitoring on Cloud before the August 2017 release: The
Availability Over Time bar chart is displayed if the application includes the
Synthetic Playback
agent (in the
Transactions navigator group and in the predefined application, My
Transactions).
Each plot point is a transaction sample with a color indicator for a status of
 Healthy,
  Slow or
  Unavailable.
 Click anywhere on the bar time line to open a pop-up window with Transaction List and Location List tables.
- The Requests and Response Time stacked bar chart is displayed if the
application includes the Response Time Monitoring Agent
(End User Transactions in the Transactions navigator
group).
Use this chart to look for trending patterns in performance. Each stacked bar plots the percentage of requests that completed with good response time, slow response time, or that failed to complete. The line chart overlay plots the average response time during the 5-minute period. Use the time selector to change the time range displayed, described in Adjusting and comparing metrics over time.
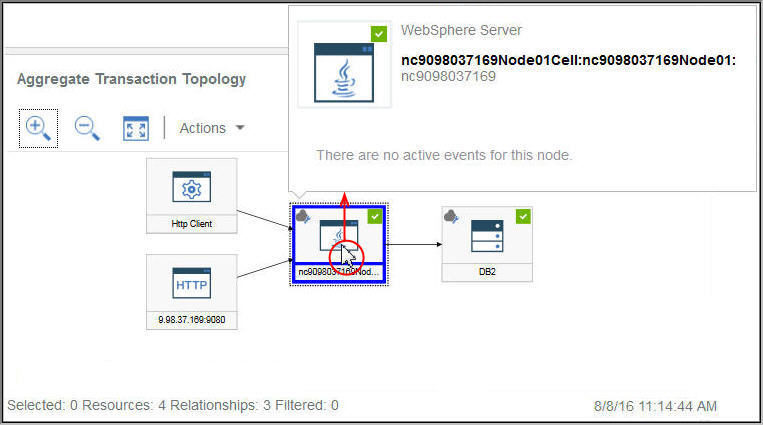
- The Aggregate Transaction Topology is displayed when transaction tracking
is enabled and the application includes any of the following agents or data collectors:
- DataPower® agent
- HTTP Server agent
- IBM Integration Bus agent
- J2SE data collector
- JBoss agent
- Liberty data collector
- Microsoft .NET agent
- Microsoft SQL Server agent
- Node.js data collector
- Response Time Monitoring agent
- SAP NetWeaver Java™ Stack agent
- Tomcat agent
- WebLogic agent (Linux and Windows only)
- WebSphere® Applications agent
- WebSphere MQ agent
The Aggregate Transaction Topology presents the resources that are associated with the application and their relationships. The footer shows a count of the selected nodes, resources, relationships, and any filters in the topology, as well as the time when the data was last refreshed.
If an application component is added to a business application, and the component carries traffic for multiple applications, the application topology that is displayed for those business applications includes paths to nodes for all applications.
For the IBM Java application stack where JavaScript is automatically injected, the highest level node represents the browser and the most granular node is the database. For other applications, the highest level node represents the application and the most granular node is the managed system instance.
Each node has a status indicator and background highlighting to show the highest status severity at that level of aggregation. If you collapse the navigator to make more space, you can still see the same status in the Aggregate Transaction Topology. The node's source environment shows as
 Cloud (IBM Cloud Application Performance Management),
  ITM (IBM
Tivoli® Monitoring),
On Premises (IBM Cloud Application Performance Management, Private) ,
Private Cloud (IBM
Cloud Private), or
ITM (IBM
Tivoli® Monitoring),
On Premises (IBM Cloud Application Performance Management, Private) ,
Private Cloud (IBM
Cloud Private), or  Public Cloud (IBM Cloud). No icon is shown for Other (managed resource is from another
environment).Hover the mouse over a node, open the shortcut menu, and select nodes to get more information about the status and help you identify the root cause of a problem:
Public Cloud (IBM Cloud). No icon is shown for Other (managed resource is from another
environment).Hover the mouse over a node, open the shortcut menu, and select nodes to get more information about the status and help you identify the root cause of a problem:- As you hover the mouse over a node, a pop-up message provides a list of the
 critical and
  warning events.
 - Double-click a link URL in a node to open the corresponding dashboard with component or transaction details.
- Right-click a node and select one of the dashboard drill down options: Go to
Transactions Summary page of the selected subgroup node; Go to Component
Instance page of the instance node; or Properties to see the
resource name, status, managed system name, and provider domain (such as
Cloud
).
Use the toolbar icons to adjust the display and take actions as described in Manipulating the Aggregate Transaction Topology widget.
Click the
 tool to toggle between this view and the Current Components Status,
described next.
tool to toggle between this view and the Current Components Status,
described next.Any monitoring agents with no topology information do not show in the Aggregate Transaction Topology widget.
- The Current Component Status stacked bar chart shows the percentage and a
count of critical, warning, normal, and unknown status for each component type in the application.
Consider, for example, that 5 Linux® systems are supporting
the selected application. A stacked bar showing 40% critical and 60% normal indicates that 2 systems
have critical status and 3 systems have normal status.
Hover the mouse over a bar segment to read the status in a pop-up window: the percentage and count of the component instances with that status. The domain or domains where the instances reside is also shown with a status count for each domain: IBM Cloud, Cloud, On Premises, ITM and Other. For example, 2 of your 5 Linux systems are in the ITM domain and 3 are in the Cloud domain. If one of the Critical systems is in the ITM domain and the other is in the Cloud domain, when you hover the mouse over the Critical 40% bar segment, the status pop-up window shows 1 system in the ITM domain and 1 in the Cloud domain.
You can click a bar to open the status summary dashboard for the component type, with a group widget for each monitored system.
Click the
tool to toggle between this view and the Aggregate Transaction
Topology, described earlier. - When the defined application consists solely of Availability Monitoring, the summary dashboard is displayed as described in Accessing Availability Monitoring.
- IBM® Website
Monitoring on Cloud before the August 2017 release: The
Availability Over Time bar chart is displayed if the application includes the
Synthetic Playback
agent (in the
Transactions navigator group and in the predefined application, My
Transactions).
Events
- The status indicators that are displayed next to the
Events tab title, such as 14 3, show a count of the highest event severities for the selected navigator
item: application, group, subgroup, or instance. Threshold severities are consolidated, as shown in
the following table. For example, Events
means that the highest severity event is minor or warning.
When your managed environment includes IBM Operations Analytics - Predictive Insights and an anomaly is detected, an event is opened. A diamond-shaped icon overlays the status indicator, such asEvents tab Threshold Severity CriticalFatal and Critical WarningMinor and Warning  Normal
Unknown  , to notify you that at least one anomaly has been detected by Operations Analytics - Predictive Insights. For example, Events
 , indicates that the highest status event is Warning and that at least one anomaly event is open.
Custom Views
The pages that you create and save are associated with the selected application. For example, the Inventory Management application in the Cloud APM Guided Demo has the following monitoring agents: Linux OS, MySQL, Node.js, Hadoop, and Ruby. You can create and save a custom page at any level of the navigator from application to instance and then open it at the same level where it was created. A page that is created at a particular level can be opened only at the same level. The metrics available for the widgets can be from any of the resources in the application. Using the Inventory Management example, you can create a page with a table from the Ruby agent, a chart from Linux OS agent, and so on.
- After you open the Custom Views tab, the Select a Template for your Custom Page window is
displayed or the default page is displayed if it is already set.
- In the Select a Template for your Custom Page window, you can select a template to create a page.
- On the default page, you can click
 to create a new page.
- On the default page, Click
 in the page list and select one of the saved pages from the list.