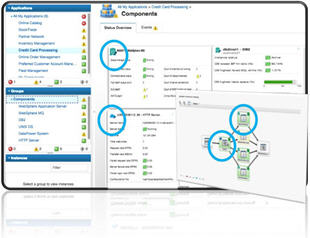
Use the dashboard for the selected application group, subgroup, or instance to get a high
level status of your managed systems. You can drill down to detailed dashboards with metrics for the
selected instance and create custom charts and tables.
After you select an application under
All My Applications in the
Application Performance Dashboard, the
Status Overview
and
Events tabs are displayed.
The navigator Groups
section lists one or more of several possible groups, depending on the constituents of the defined
application.
Status Overview
- Groups and subgroups
-
- Select a group or
 expand a group and select a subgroup to see a summary group widget for each managed system
in the application. After you select a subgroup, the summary group widgets in the Status
Overview tab are specific to that subgroup.
- The following predefined groups are available, depending on which monitoring products are installed:
 Availability Monitoring
- This group is displayed for custom applications. The navigation behavior for Availability Monitoring is different from the
Components and Transactions groups.
- The
Availability Monitoring add-on and dashboards
are described in Availability Monitoring.
 Components
- This group is displayed for all applications, with the exception of the
Response Time Monitoring Agent, the Synthetic Playback
agent, and Availability Monitoring.
- The Components has a subgroup for each monitored software component that
supports the selected application.
 Transactions
- This group includes End User Transactions and Synthetic
Transactions
(IBM Website
Monitoring on Cloud before the August 2017 release)
subgroups. For more information, see
the help
for Transaction Monitoring and the Synthetic Playback
agent or their reference PDFs on
the IBM Knowledge Center for Monitoring Agent Reference
Guides.
Note: The Transactions group is not available
for the My Components application.
- After you select Components or a subgroup from the
Groups section, the Status Overview tab changes to show
a summary dashboard with a group widget for each managed resource. The source environment shows as
 Cloud (IBM Cloud Application Performance Management),
  ITM (IBM
Tivoli® Monitoring),
  On Premises (IBM Cloud Application Performance Management, Private) ,
  Private Cloud (IBM
Cloud Private), or
  Public Cloud (IBM Cloud). The
Instances section is renamed for the subgroup title and is populated with the
individual instance names.
 If the application has many managed system instances,
many group widgets are displayed. You can scroll through the list to seem them all. You can also
select a managed system type from the list of component subgroups, such as Windows OS, to confine
the display to the same managed system types. You can also filter the managed system instances.
Firefox browser only: Depending on the number of agents and
bandwidth, as you scroll down the Components page, you might see a pop-up message that the script to
load the resource page takes a long time to complete. Select the option, Don't ask me again
to disable the message and continue opening the widgets. Alternatively, you can enter
about:config in the address box, search for
dom.max_script_run_time and increase the time out value (in seconds). A value
of 0 (zero) disables time out.
- Instances
-
- Click inside a group widget or select the instance name from the navigator to open a detailed
dashboard for the managed resource.
- If many instances are displayed in the navigator, use the search
field
 in the Instances toolbar. As you type, any instances that do not match are removed from the
display.
- To pause the Application Performance Dashboard automatic refresh, click
 Pause in the Instances toolbar; to resume automatic refresh, click
  Resume.
- The widgets and KPIs shown for any managed system might depend on the agent version. If an agent
installed on the managed system is at an earlier version, it might be unable to provide as much
information as the current version of the agent. A message is displayed instead of one or more KPIs
in a chart or table when no data is available. The reason could be as simple as no data was reported
for the time span. Or it could be related to a back-leveled agent that doesn't support the data set
or an attribute included in the chart or table.
To
see a list of agent dashboards that were updated since the last Cloud
APM server restart, select .
- Some of the
dashboard widgets show metrics that are based on a time range, and other widgets show the most
recent metrics. If a time selector bar is displayed, you can adjust the time range for the dashboard
that affects any charts or tables whose values are derived from historical data samples. For more
information, see Adjusting and comparing metrics over time.
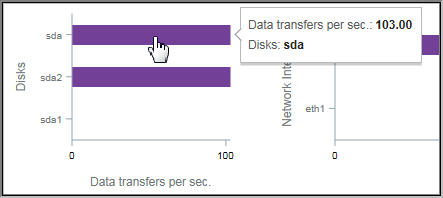
While
viewing charts, you can click a plot point to open a tool tip with the plot point value and other
pertinent information. After viewing a line chart in the Internet Explorer Version 11 browser, you
might continue to see the tool tip appear as you move the cursor around the window. If you
experience this behavior, you can close the tool tip by clicking a few times in the chart.
- If you're viewing a chart with bars missing, it means
that the value is 0 (zero) for that data point.
- IBM
Cloud Application Performance Management, Advanced users have additional
diagnostics dashboards that are accessed by clicking the Diagnose link from a
group widget in the details dashboard.
Restriction: The managed
system for which you are opening the diagnostics dashboards must reside in the
IBM
Cloud
APM domain. If the managed system resides
in the
IBM Cloud or
IBM
Tivoli Monitoring source domain, the diagnostics dashboards are not
available.
See also Cloud APM agent and Tivoli Monitoring agent coexistence.
- If your environment includes the Synthetic Playback
agent, you can launch Cloud
APM reports for the agent instance from the
Actions menu.
Events
- The status indicators that are displayed next to the
Events tab title, such as
 14
14  3, show a count of the highest event severities for the selected navigator
item: application, group, subgroup, or instance. Threshold severities are consolidated, as shown in
the following table. For example, Events
 means that the highest severity event is minor or warning.
| Events tab |
Threshold Severity |
 Critical Critical |
Fatal and Critical |
 Warning Warning |
Minor and Warning |
 Normal Normal |
Unknown |
When your managed environment includes IBM
Operations Analytics - Predictive Insights and an anomaly is detected, an event is
opened. A diamond-shaped icon overlays the status indicator, such as
 , to notify you that at least one anomaly has been detected by Operations Analytics - Predictive Insights. For example, Events
 , indicates that the highest status event is
  Warning and that at least one anomaly event is open.
- Click the Events tab to see a summary of the total event count, a count
of each severity type, and a percentage gauge for the severities. For more information, see Event Status.
Custom Views
The pages that you create and save are associated with the selected application.
For example, the Inventory Management application in the Cloud
APM
Guided
Demo has the following monitoring agents: Linux® OS, MySQL, Node.js, Hadoop, and Ruby. You can create and
save a custom page at any level of the navigator from application to instance and then open it at
the same level where it was created. A page that is created at a particular level can be opened only
at the same level. The metrics available for the widgets can be from any of the resources in the
application. Using the Inventory Management example, you can create a page with a table from the
Ruby agent, a chart from Linux OS agent, and so on.
- The Custom Views tab is available at any level of the navigator when you
select an application from All My Applications.
- After you open the Custom Views tab, the Select a Template for your Custom Page window is
displayed or the default page is displayed if it is already set.
- In the Select a Template for your Custom Page window, you can select a
template to create a page.
- On the default page, you can click
 to create a new page.
- On the default page, Click
 in the page list and select one of the saved pages from the list.
- The options that you see in the Custom Views tab vary based on whether a page is
being edited or viewed. For information about editing a page, see Creating and managing custom pages. For information about viewing a page, see Viewing custom pages.
Attribute Details
- The Attribute Details tab is displayed after you select a component
instance from the navigator Instances section (renamed to the selected subgroup
name) or by clicking inside a summary group widget.
- If chart or table pages have been saved for the agent, the most recently opened page is
displayed with metrics from the selected component instance. Click the title
 to select a different saved page from My Pages
 or Shared Pages
 .
.
- You can edit the chart or table and click Preview Results
to render the chart or table with the selected attributes. For more options, see Creating a custom chart or table page.
 expand a group and select a subgroup to see a summary group widget for each managed system
in the application. After you select a subgroup, the summary group widgets in the


 in the Instances toolbar. As you type, any instances that do not match are removed from the
display.


 14
14  3
3 Normal
 , to notify you that at least one anomaly has been detected by
  , indicates that the highest status event is
  to select a different saved page from
  or
or