Editing the Components dashboard group widgets
You can edit the threshold values of the group widgets that display in the Components dashboard (selected from the navigator Groups section). You can also control which group widgets are displayed and their position, and decide whether a widget threshold should be included in determining the component status.
About this task
Your user ID must also have the modify permission for Application Performance Dashboard and the create permission for Applications. For more information, see Roles and permissions.
Procedure
-
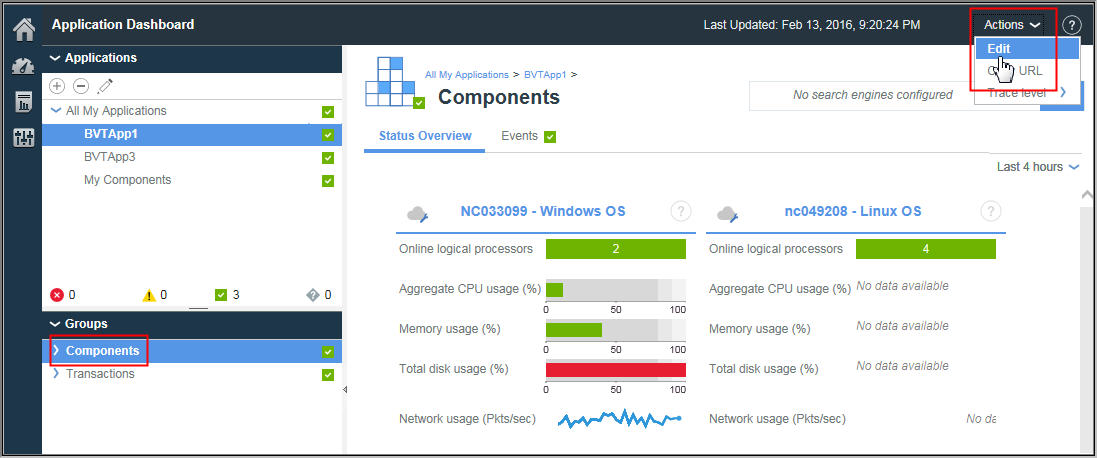
After you open the Application Performance Dashboard from the
 Performance menu, select the application whose summary group widgets you want
to edit from the All My Applications dashboard.
Performance menu, select the application whose summary group widgets you want
to edit from the All My Applications dashboard.
-
Click to open the editor for the group widgets in the Components
group.
The Edit option shows only when the Components dashboard is open.
- Make any of the following changes to the group widgets:
- To remove a group widget from view, click
 .
. - To modify the summary thresholds for a widget, click
 Settings, select the Thresholds tab, and change the
threshold values for the critical, warning, or normal severity. After editing the thresholds for the
group widget, click Done.
Settings, select the Thresholds tab, and change the
threshold values for the critical, warning, or normal severity. After editing the thresholds for the
group widget, click Done. - To add a widget, click
 , click applications icons until the one that you want is displayed, click inside the group
widget to select it, and click Add.
, click applications icons until the one that you want is displayed, click inside the group
widget to select it, and click Add. - To resize a widget, drag the handle icon
 . Resizing a widget does not change the size of the text or the height of the
widget.
. Resizing a widget does not change the size of the text or the height of the
widget. - To move a widget, drag it to a new position.
- To remove a group widget from view, click
Results
What to do next
 button in the Application
Dashboard banner.
button in the Application
Dashboard banner.