News
Abstract
The following updates are available in release 2.0.99 of Planning Analytics Workspace.
Content
The Planning Analytics AI assistant now supports English, Spanish, French, and German.
If you're using Planning Analytics Workspace in any other language, the Planning Analytics AI assistant defaults to English.

New advanced synchronization options for member change
Two new options, Member and leaves and Leaves, are now available for member change events under Advanced synchronization.
The Advanced synchronization feature allows you to customize how each hierarchy in the cube viewer or visualization displays when a synchronization event is received by that widget. When a member change synchronization occurs, in addition to other options, you can now choose to display the member and its leaves or just the leaves in the widget that is receiving the synchronization event.


New waterfall visualization
A new type of waterfall visualization is now available.
The new visualization is named Waterfall. The preexisting waterfall visualization is renamed to Legacy waterfall, and can still be used.
The following example shows a typical waterfall visualization. This visualization is used to show some kind of a measure (Net Operating Income in the example) over a period of a year. The previous year (2003) is shown as a starting point. Then the visualization lists the numbers for each month or quarter, and ends with the total for the entire year (2004).

When comparing the new waterfall visualization to the legacy waterfall visualization, the following two options in the new visualization significantly improve the user experience:
- The Change the bar type as option in the bar right-click menu.
Use this option to change the bar type to one of the following types: Auto, Delta, Adjustment, or Subtotal
- The Accumulate totals property under Visualizations > Data.
Use this property to correctly render values from multiple Total bars in the visualization instead of changing the TM1 data.
No upgrade process is provided for replacing the legacy waterfall visualization with the new waterfall visualization in existing content. If you want to use the new visualization in existing views, you need to reopen the book and manually replace the legacy waterfall with the new waterfall visualization.

Use action buttons to synchronize groups and hierarchies on navigation
With the new Advanced context feature in action buttons, you can now pass context and synchronize groups between books on navigation. Widgets in the same group synchronize together. You can also select which hierarchies are used to pass context.
Previously, action buttons depended on the default synchronization group to provide context to the same synchronization group in the target book. These groups had to have names that were an exact match and the context of all common hierarchies from the default synchronization group were passed to the target.
With Advanced context, you can map a source synchronization group to a target synchronization group and select which hierarchies that are common to both groups, receive context. You can configure multiple action buttons to pass context to a single target book and drill through data easily.
Before you can map a synchronization group from the source book to the synchronization group in the target book, you need to first set up synchronization and the widgets in both books need to be of the same synchronization group. Advanced context supports all three synchronization groups (Book, Sheet, and Custom).
To map synchronization groups and configure context passing, follow these steps:
- In edit mode, add an action button to the source book.
- Go to the action button's Properties and under Navigation, enable Navigate to destination.
- Click Other book and select a target book and the tab that you want to pass context to.
- Click Pass context.
The Advanced context link becomes available.
- Click Advanced context and select Custom group mapping.
Note: The Default group mapping displays the default synchronization groups and hierarchies. To edit or configure these settings, go to Custom group mapping.
- Select the source group, which passes the context, the target group that receives the context, and the hierarchies you want to synchronize.
You can add more mappings or remove existing ones under Custom.
Now, change the hierarchies in a widget in the source book and click the action button. You automatically navigate to the target book and hierarchies that were selected to synchronize, update in the widget.


Roll back value changes in a view
Use the new Roll back data entry button to roll back value changes in a view.
The Roll back data entry button is located on the workbench toolbar.

This button is disabled when none of the views in the workbench contains changed values. As soon as a value is changed in any view, the button is enabled and remains enabled as long as any view contains changed values. Even if you save and close the view with the changed value, and save and close the workbench, the button remains enabled unless you commit the data.
The button rolls back values starting with the most recent change in any view, no matter if the view is open or closed, including when the view is open in a separate window, or the value is in a single cell visualization. You need to click the button to roll back each change. You cannot roll back all changes in one click.
For consolidated values, all contributing values are also rolled back.

Thumb cells formatting options for a view
The Format manager now includes options to format the thumb cells in a view.
The thumb cells are located on the row and column axis of the cube viewer, on top of the row headers and to the left of the column header, as highlighted in the following image:

Until now, these cells could not be formatted. For example, no text could be entered as a column header, the cell background was always gray, and the arrow icons were always present. Starting with this release, users can change the display of these cells by using the Thumb formatting options in Format manager, in the Column header and Row header sections.
The following image shows the Thumb options in the Format manager. These options are identical for column headers and row headers.

Use these options to apply the following changes to the thumb cells:
Show thumb
Use this option to hide the thumb cells on top of the row headers and to the left of the column header. You can enable the thumb cells for just the row header, column header, or both. This option is enabled by default.
Show hierarchy
Note: This option controls the display of the attribute headings, if you used the Show attributes option with the thumb cells. These headings are displayed only when Show hierarchy is selected.
Show icon
Use this options to show or hide the arrow icon in the thumb cells. This option is enabled by default.
Apply format
Use this option if you want to apply the column header format to the column thumb cells, and the row header format to the row thumb cells.

Save a cube view as a native view
You can now save a cube view as a native view.
The Save to server menu option and dialog box was renamed to Save to database.

The Save to database dialog box now includes the Native option which allows you to save an MDX view as a native TM1 view.

Note: When a view contains a calculation, it cannot be saved as a native view.
In the Name field, you can rename the view, or select another view from the drop-down menu, which shows names of other existing views. If you select the Default checkbox, the Name input field is disabled, and the current view is selected as the default view.

Enhanced Action button search function
The search function for selecting databases and processes for an Action button in Planning Analytics Workspace includes these improvements.
Search function filters
When you type the name of a process or database, the search function now filters for results with the same name.

Regular processes and control processes now returned in search
When you search for processes, both regular TurboIntegrator processes and control processes are shown in the results.

Changed Selector menu options
The menu options for adding a Selector widget have changed. These options are now also available from the Data tree.
These options are now consistent in the Data tree, the cube viewer, and the Fields panel.
- Add selector tile
Use to add the selector widget as a tile. You can add 3 types of tiles: Single tile, Multiple tiles, and Range selection tile.
- Add selector list
Use to add the selector widget as a list. You can add 3 types of lists: Single list, Multiple lists, and Multiple selection list.
- Dimension context menu
- Hierarchy context menu
- Sets context menu
In the following example, the new menu options are shown from a dimension context menu on the Data tree:

Drive explorer enhancements
New features have been added to the Drive explorer in the Planning Analytics Workspace modelling workbench.
View the number of files in a directory
When you are in a directory, you can now view the number of items in that directory. This feature is helpful for providing at-a-glance information about the files in large directories. For example, you can see the number of log files you have in a logging directory.

View disk space
You can now view the total amount of disk space you have and the amount of disk space you have left.

Inline notifications
The drive explorer now displays inline notifications about the status of actions you perform. For example, when compressing files, an inline notification appears when the process is being performed, and when it is complete.
Unzipping files
The process for unzipping files has improved. You can now expand a file into the directory you are viewing, or into a folder.
To expand a file into the directory you are viewing, click Expand.
To expand a file into a folder, click Expand to, name the folder, and click Create. The contents of the unzipped file are in the newly created folder.
Overwrite notification when expanding a file
If you expand a file to an existing folder with the same name, the following notification appears:
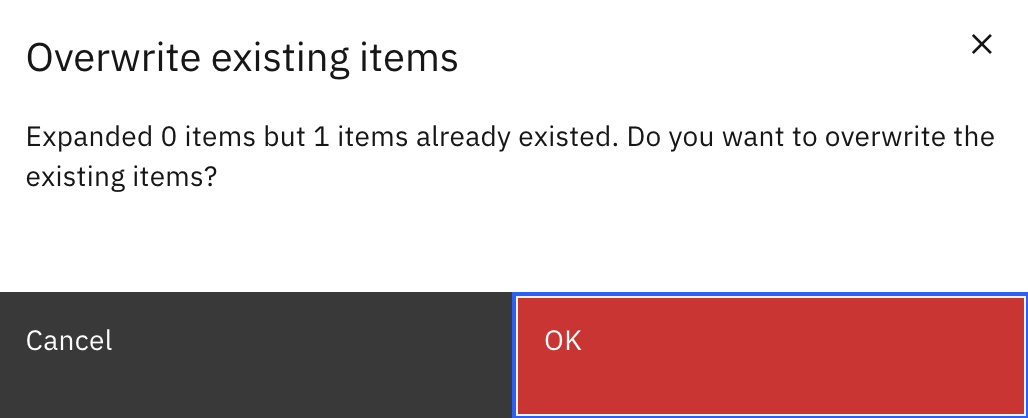
You cannot choose which files are overwritten. The notification appears only once.
Tm1s.log
The tm1s.log file is now visible in the directory. The file's presence can be seen, but it cannot be opened or deleted.
Improved performance
The drive explorer has improved performance when displaying a large number of files and folders.

Improved verification of valid file types on file upload
On file upload, Planning Analytics Workspace now determines the validity of a file based on the file type instead of the file extension.
Some of the file types that are supported include:
- Text files (such as .txt, .csv, .css, .html)
- Application files (such as .docx, .json, .ics, .xml, .php, .pdf, .zip, .7z, .rtf, .rar, .xlsm)
- Image files (such as .jpeg, .jpg, .svg, .gif, .png, .heic)
- Font files (such as .tff,. woff, .otf)
- Video files (such as .mp4, .mpeg, .avi)
- Audio files (such as .mp3, .wav, .weba, .mid)

Export data from a cube or view on a modeling workbench
You can now export data from a cube or view to a .csv file. The exported file is saved to your local Downloads directory.
To export data from a cube, right-click the cube on the modeling workbench Databases tree, then click Export data.
To export data from a view, right-click the view on the modeling workbench Databases tree, then click Import/Export > Export data.

When you export data, you can set options that determine:
- which hierarchy, set, and/or members to include in the export
- a range of numeric or string values to include in the export
- whether consolidated, rule-derived, or zero value are included in the export

Export a dimension or hierarchy from a modeling workbench
You can now export a dimension or a dimension hierarchy to a .csv file. The exported file is saved to your local Downloads directory.
To export, right-click a dimension or hierarchy on the modeling workbench Databases tree, then click Export members.

You can also click the Export members icon ![]() on the dimension editor to export a dimension.
on the dimension editor to export a dimension.
When you export a dimension or hierarchy, the resulting .csv file includes the following information about each member:
- name
- parent/child relationship
- type
- weight
- any defined attribute names and values
Attribute names are prefixed with either ATTR_N or ATTR_S when they are exported, depending on the attribute type (numeric or string, respectively).

Manage users and groups on a local Planning Analytics database
You can now manage Planning Analytics local database users and groups from the modeling workbench.
This capability requires that your Planning Analytics local environment uses TM1 authentication (as opposed to CAM authentication). Your authentication mode is determined by the PAAuthMode setting in the paw.ps1 (Windows) or paw.env (Linux) configuration file for your local installation.
To manage users and groups on a Planning Analytics database, right-click the database on the modeling workbench Databases tree, then click Manage users and groups. The procedures for managing users and groups on a local environment are the same as for Planning Analytics on Cloud. For more information, see Manage users and groups on a Planning Analytics database.
IBM watsonx.ai integration and multiple deployment capabilities (Local only)
The IBM Cloud Pak for Data integration, which supports Decision Optimization, was renamed to IBM watsonx.ai in Planning Analytics Workspace Local 2.0.99. You can now also configure multiple deployments of the IBM watsonx.ai integration. Both these changes are also available in Planning Analytics Workspace on Cloud 2.0.98 and later versions.
The Integrations tile now looks slightly different to support the ability to configure multiple deployments of the watsonx.ai integration. To add a new deployment, click Add or use the context menu of an existing deployment to duplicate it and edit the relevant fields.
You can modify or delete an existing deployment and use the Status toggle to enable or disable a deployment.
For more information, see Configure integration with IBM watsonx.ai to support Decision Optimization.

Identify the HTTP port number for a Planning Analytics database (Cloud only)
You can now easily identify the HTTP port number for a database in Planning Analytics Administration.
To view the port number for a database:
- Open Planning Analytics Administration
- Click the Databases tile, then click a database name.
The port number is shown as the REST API Port on the Details tab.

Was this topic helpful?
Document Information
Modified date:
26 November 2024
UID
ibm17172963