Troubleshooting
Problem
Symptom
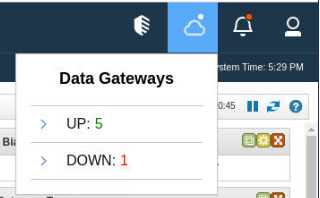
- Log in to the QRadar on Cloud Console as the administrator user.
- Click the Cloud icon in the upper right section.
- Expand the "DOWN" list.
Cause
Environment
Diagnosing The Problem
Unknown networking changes
- Log in to the Data Gateway CLI as the root user.
- Review the /var/log/openvpn.log file by using the cat command.
cat /var/log/openvpn.log

{Date} us=172847 TCP_CLIENT link remote: [AF_INET]<QRoC VPN Server Public IP>:443
{Date} us=190955 Connection reset, restarting [-1]
{Date} us=191070 TCP/UDP: Closing socket
Network congestion
Data Gateways require a minimum bandwidth of 40Mbps symmetrical to function properly. At lower transfer rates, other QRadar processes for the DG are affected, including configuration deploy actions, regular database replication, or performance degradation which can cause events to be written to the persistent queue on the DG.
Note: The following diagnosis steps require the VPN tunnel to be established. See "Unknown networking changes" to determine whether the VPN is established.
- Log in to the Data Gateway CLI as the root user.
- Review the /var/log/qradar.log file, by using the grep command and ensure the downloading time is under 5000 milliseconds.
grep "Replication download" /var/log/qradar.log | tail

<DG HOSTNAME> replication[13866]: Replication download timing: Downloading: 3500 ms Overall: 453 ms DB transaction: 20 ms Transaction verification: 6 ms
High Latency
As Data Gateways can be deployed in different places, the latency (transmission time between points A and B) might vary, however, a value of 150ms is considered acceptable. The lowest latency possible is always preferred. High latency links can decrease the effective transfer rate and affects bandwidth.
- Obtain the Console's Private IP.
- Method #1 - WebUI.
- Log in to the QRadar Console as an administrator user.
- Click the Admin tab.
- In the left pane, select Apps.
- Click QRoC Self-Serve.
- Click Deployment.
- Look for the Console's Private IP.
- Method #2 - CLI.
- Log in to the Data Gateway CLI as the root user.
- Use the grep command to obtain the Console's Private IP.
grep CONSOLE_PRIVATE_IP /opt/qradar/conf/nva.conf
- Method #1 - WebUI.
- Use the ping and tcptraceroute command to measure the latency from the DG to the QRoC Console.
Example of ping:
In the previous output, the DG reports the connection to the Console is 2545.293 ms and has a 25% of packet loss.[root@<DG hostname> ~]# ping <QRoC Console Private IP> -c 10 PING <QRoC Console Private IP> (<QRoC Console Private IP>) 56(84) bytes of data. 64 bytes from <QRoC Console Private IP> icmp_seq=1 ttl=63 time=2500 ms 64 bytes from <QRoC Console Private IP>: icmp_seq=2 ttl=63 time=2184 ms 64 bytes from <QRoC Console Private IP>: icmp_seq=3 ttl=63 time=2547 ms 64 bytes from <QRoC Console Private IP>: icmp_seq=4 ttl=63 time=2201 ms 64 bytes from <QRoC Console Private IP>: icmp_seq=5 ttl=63 time=2117 ms 64 bytes from <QRoC Console Private IP>: icmp_seq=6 ttl=63 time=3008 ms 64 bytes from <QRoC Console Private IP>: icmp_seq=7 ttl=63 time=2946 ms 64 bytes from <QRoC Console Private IP>: icmp_seq=8 ttl=63 time=2530 ms 64 bytes from <QRoC Console Private IP>: icmp_seq=9 ttl=63 time=2870 ms 64 bytes from <QRoC Console Private IP>: icmp_seq=10 ttl=63 time=2830 ms --- <QRoC Console Private IP> ping statistics --- 10 packets transmitted, 8 received, 25% packet loss, time 11005ms rtt min/avg/max/mdev = 2117.453/2545.293/3008.992/318.923 ms, pipe 4
Example of tcptraceroute:
In the previous output, the "hop 3" reports the Console was reached in 52.767 ms.[root@<DG HOSTNAME> ~]# tcptraceroute <QRoC Console Private IP> 443 traceroute to <QRoC Private IP> (<QRoC Private IP>), 30 hops max, 60 byte packets 1 192.168.47.1 (192.168.47.1) 52.806 ms 52.769 ms 52.756 ms 2 * * * 3 console-xxxxx.qradar.ibmcloud.com (<QRoC Private IP>) <syn,ack> 52.767 ms 52.702 ms 52.706 ms
Resolving The Problem
Unknown networking changes
Administrators must follow the steps in this technote: QRadar on Cloud: Troubleshooting Data Gateway appliance connectivity before running the steps in this technote.
- Determine whether the DG's Public IP changed by using the curl command.
Note: The following command works only if the DG has open internet access or at least access to https://ifconfig.me.curl -k https://ifconfig.me - Verify the reported Public IP is in the QRoC allowlist.
- Log in to the QRadar Console as an administrator user.
- Click the Admin tab.
- In the left pane, select Apps.
- Click QRoC Self-Serve.
- Click the Allowlist Management menu.
- Add the Public IP to the allowlist. For more information, see How to add an IP address to the allowlist.
- Reach to the networking team where the DG is hosted and request an update in the networking configuration:
- The 1:1 NAT configuration must use the new IP.
- The proxy server (when present) allows the connection to the QRoC (Console and VPN Server) Public IP by using the new IP.
- Restart the openvpn@client service.
systemctl restart openvpn@client - Verify the tunnel (tun0 interface) establishes and appears in the routing table by using the route command.
route -nExample:[root@<DG HOSTNAME> ~]# route -n Kernel IP routing table Destination Gateway Genmask Flags Metric Ref Use Iface 0.0.0.0 10.10.10.1 0.0.0.0 UG 0 0 0 ens192 10.10.10.0 0.0.0.0 255.255.255.0 U 0 0 0 ens192 <QRoC Console Private IP> 192.168.13.1 255.255.255.255 UGH 0 0 0 tun0 192.168.13.0 0.0.0.0 255.255.255.0 U 0 0 0 tun0 - Test the Console response by using the nc command.
nc <QRoC Console Private IP> 443Example:[root@<DG HOSTNAME> ~]# nc -zv <QRoC Console Private IP> 443 Ncat: Version 7.50 ( https://nmap.org/ncat ) Ncat: Connected - Wait 10 minutes for the DG to report the active status.
Network congestion
Administrators must request bandwidth tests to the networking team where the DG is hosted to determine where the network congestion occurs. Usually, bandwidth tests in these sections are enough to determine where the network congestion is:
- DG premises (where the DG is hosted). Bandwidth test from DG premises to network boundaries (typically a network border router or server) must report at least 40Mbps symmetrical.
- The internet. Bandwidth test from the DG to a server on the cloud (ideally on IBM Cloud). This test verifies the ISP link the DG connection uses to reach QRadar on Cloud (IBM Cloud).
High Latency
High latency is caused by a sum of geographical distance (expected) and network congestion. The administrators can use the traceroute commands to determine where the latency increases out of the expected values.
- Use the tcptraceroute command to the QRoC Console Public IP and VPN Server Public IP.
- Obtain the Public IP of the Console or VPN Server.
- Log in to the QRadar Console as an administrator user.
- Click the Admin tab.
- In the left pane, select Apps.
- Click QRoC Self-Serve.
- Click Deployment.
- Look for the Console's Public IP or VPN Server Public IP.
- Run the tcptraceroute command.
Example:tcptraceroute <QRoC Console Public IP> 443 or tcptraceroute <QRoC VPN Server Public IP> 443
In the previous output, hops 1 and 2 belong to customer premises, hops 3 - 10 are the ISP network and hop 11 - 15 are IBM Cloud. The hop 16 shows the QRoC Console Public IP is reachable in 42.271 ms on average.tcptraceroute <QRoC Console Public IP> 443 traceroute to <QRoC Console Public IP> (<QRoC Console Public IP>), 30 hops max, 60 byte packets 1 10.5.195.251 (10.5.195.251) 0.333 ms 10.5.195.252 (10.5.195.252) 0.256 ms 0.349 ms 2 10.5.106.20 (10.5.106.20) 0.525 ms 0.648 ms 0.502 ms 3 209.12.237.60 (209.12.237.60) 0.844 ms 0.952 ms 0.943 ms 4 66.55.35.81 (66.55.35.81) 1.667 ms 1.898 ms 1.758 ms 5 ae0-250G.ar1.DAL1.gblx.net (67.17.95.74) 3.909 ms 4.022 ms 4.000 ms 6 * * * 7 4.14.131.62 (4.14.131.62) 3.060 ms 3.244 ms 3.221 ms 8 ae5.cbs01.eq01.dal03.networklayer.com (50.97.17.52) 3.948 ms * * 9 * * * 10 * * * 11 ae7.cbs02.cs01.lax01.networklayer.com (50.97.17.61) 41.580 ms 40.424 ms 39.680 ms 12 ae0.cbs02.eq01.sjc02.networklayer.com (50.97.17.87) 44.297 ms 43.954 ms 42.194 ms 13 e5.11.6132.ip4.static.sl-reverse.com (50.97.17.229) 52.228 ms e7.11.6132.ip4.static.sl-reverse.com (50.97.17.231) 42.238 ms 43.581 ms 14 po1.fcr02a.sjc03.networklayer.com (169.45.118.153) 40.735 ms po2.fcr02b.sjc03.networklayer.com (169.45.118.159) 40.717 ms 42.443 ms 15 e5.96.2ca9.ip4.static.sl-reverse.com (169.44.150.229) 43.537 ms 41.603 ms 40.283 ms 16 14.b4.2ca9.ip4.static.sl-reverse.com (<QRoC Console Public IP>) <syn,ack> 41.607 ms 71.718 ms 42.271 ms
- Obtain the Public IP of the Console or VPN Server.
Related Information
Document Location
Worldwide
Was this topic helpful?
Document Information
Modified date:
31 October 2023
UID
ibm16585626