News
Abstract
Visualize Monitor Data
Content
- For a full article on the basics under IBM Navigator for i: System & Message Monitors Overview
Monitors are supported on 7.2 and later releases.
This includes the ability to Visualize Monitor Data to view All Metrics for a specific system monitor on one panel:
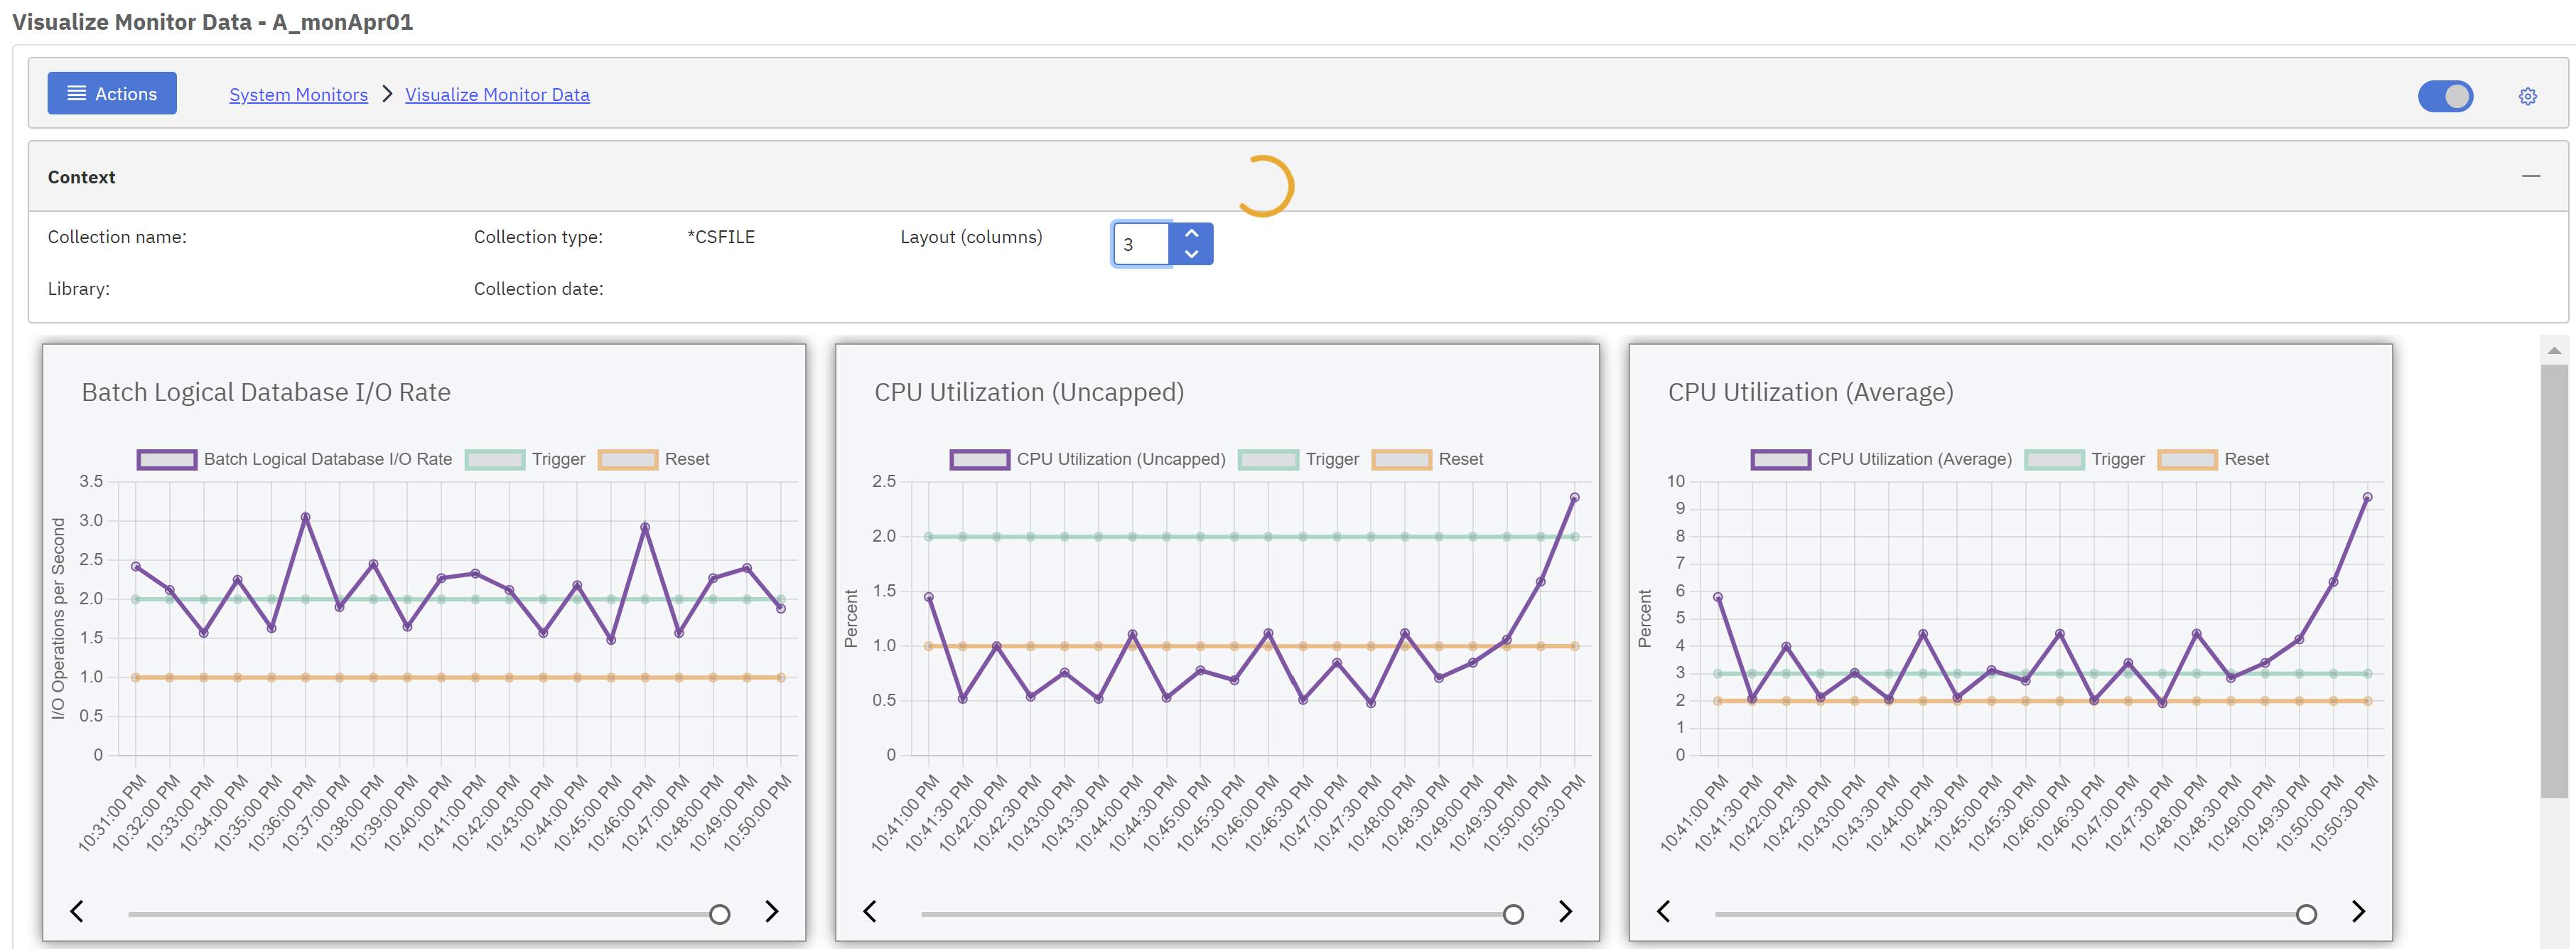
Coordinate Scrolling
Select this option to scroll across the collection intervals and have all graphs on the page display the same intervals as you move the slider on one chart.
Show Thresholds
Show thresholds allows you to see thresholds for the charted monitor metric.
Deselect to turn off. When deselected the chart view may zoom in on the chart range displayed if the threshold is very distant from the actual metric values being charted.
This option is selected by default to show thresholds.
Layout
Chart layout (number of columns and positioning) is configurable.
- To change the number of columns, modify the Layout field on the context panel.
- Close any graph by clicking on the chart title bar twistie.
- Move graphs to different locations on the panel by selecting with mouse, dragging and dropping to a new location.
At this time, configuration changes are not preserved across logout and launches to panels. This is planned for the future.
Automatic Refresh
Automatic refresh will refresh each chart at the metric collection interval. This is on by default. Uncheck to turn off and enable the manual Refresh button.
Launch to Other charts
From the Actions menu, you can select to launch to other charts.
- Launch to Historical Summary graphs for the related metric (7.3 and later)
- System Monitor charts will bring you to the single metric classic PDI perspective
- Collection Services will bring you to the active Collection classic PDI perspective
<will be provided in a future PTF release>
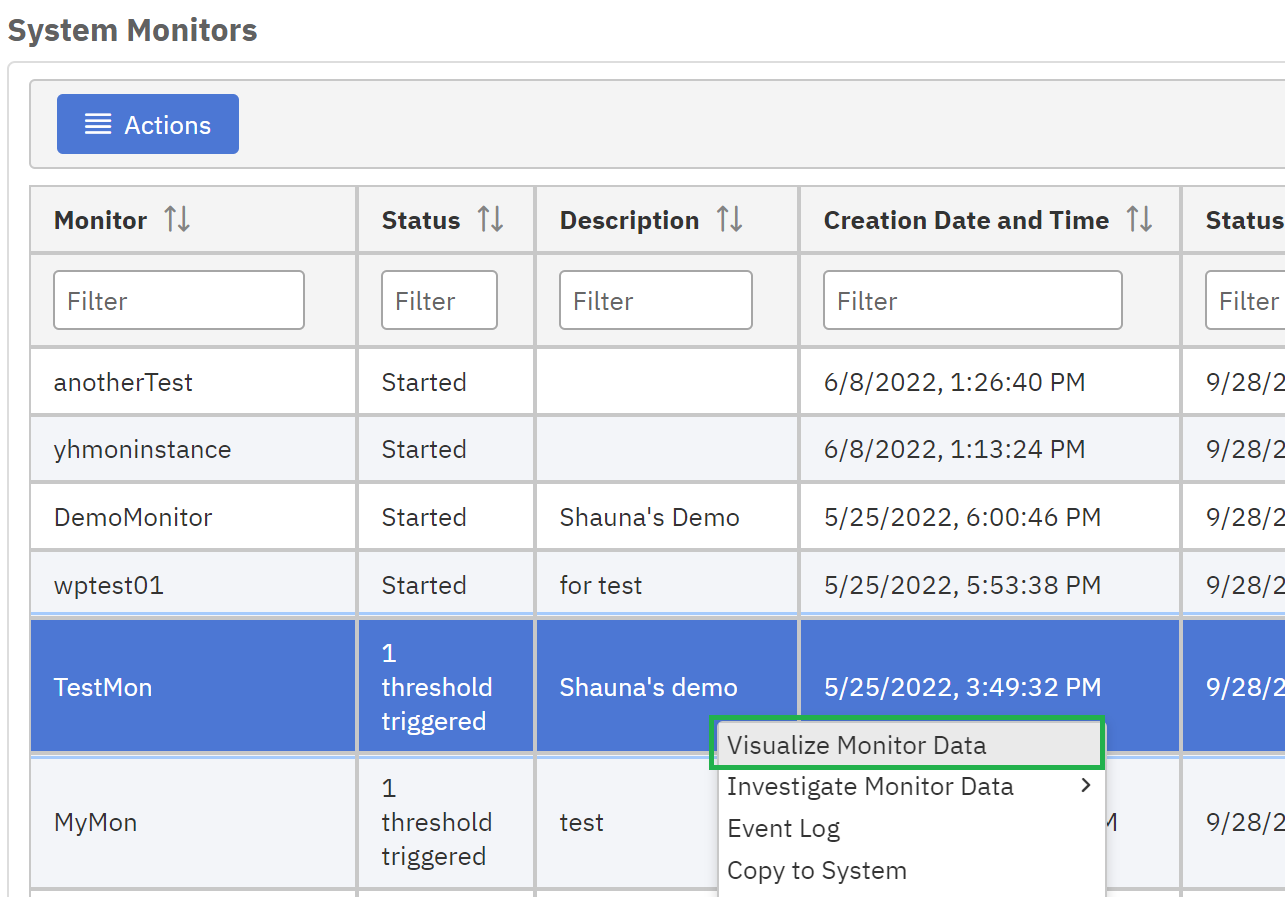
Launch from System Monitors
Use either option: Visualize Monitor Data to view the monitor data in a multi-metric panel
Was this topic helpful?
Document Information
Modified date:
28 September 2022
UID
ibm11127019