News
Abstract
The dashboard provides a basic view of the health and status for any IBM i endpoint that you want to monitor and manage from IBM Navigator.
Content

When you want to work with one system, double-click that system tile or row. You can also select the "Manage->" button.
Select the ellipsis (3 vertical dots) to open the actions menu. Several icons are shown with actions for each node. You can also right-click a node tile to see the full list of actions.

Whether on the Dashboard or Home page, you will see a paddle-lock which will show current status of the connections for that node. If using secured connections, the paddle-lock will be closed (locked) as in the above screenshot.
If the managed node is not using secured connections, the paddle-lock will be unlocked as in this screenshot:

For more on TLS connections and securing your system, see IBM Navigator for i - TLS Encryption.
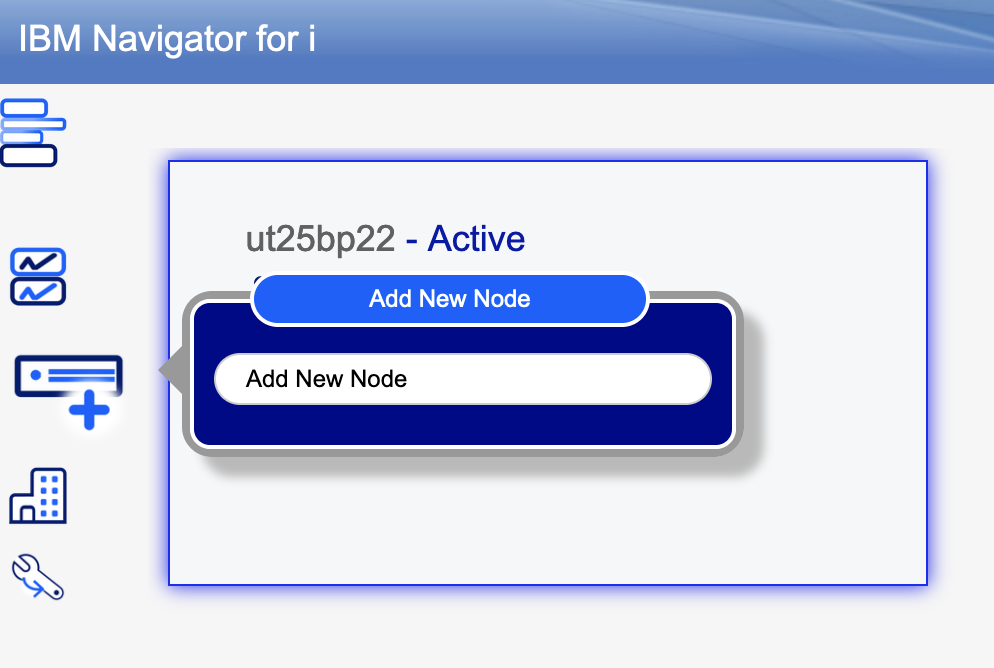
To add more nodes to the dashboard, click the "Add New Node" menu action.
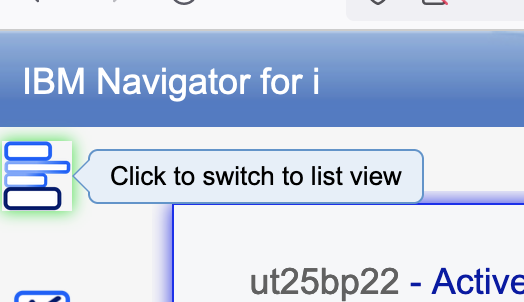
The dashboard can be shown in two different layouts: the tile view (which is the default) or the list view. For users with a large number of systems to manage, the list view can be easier to navigate.
Click the "Switch View" icon, found in the upper left.
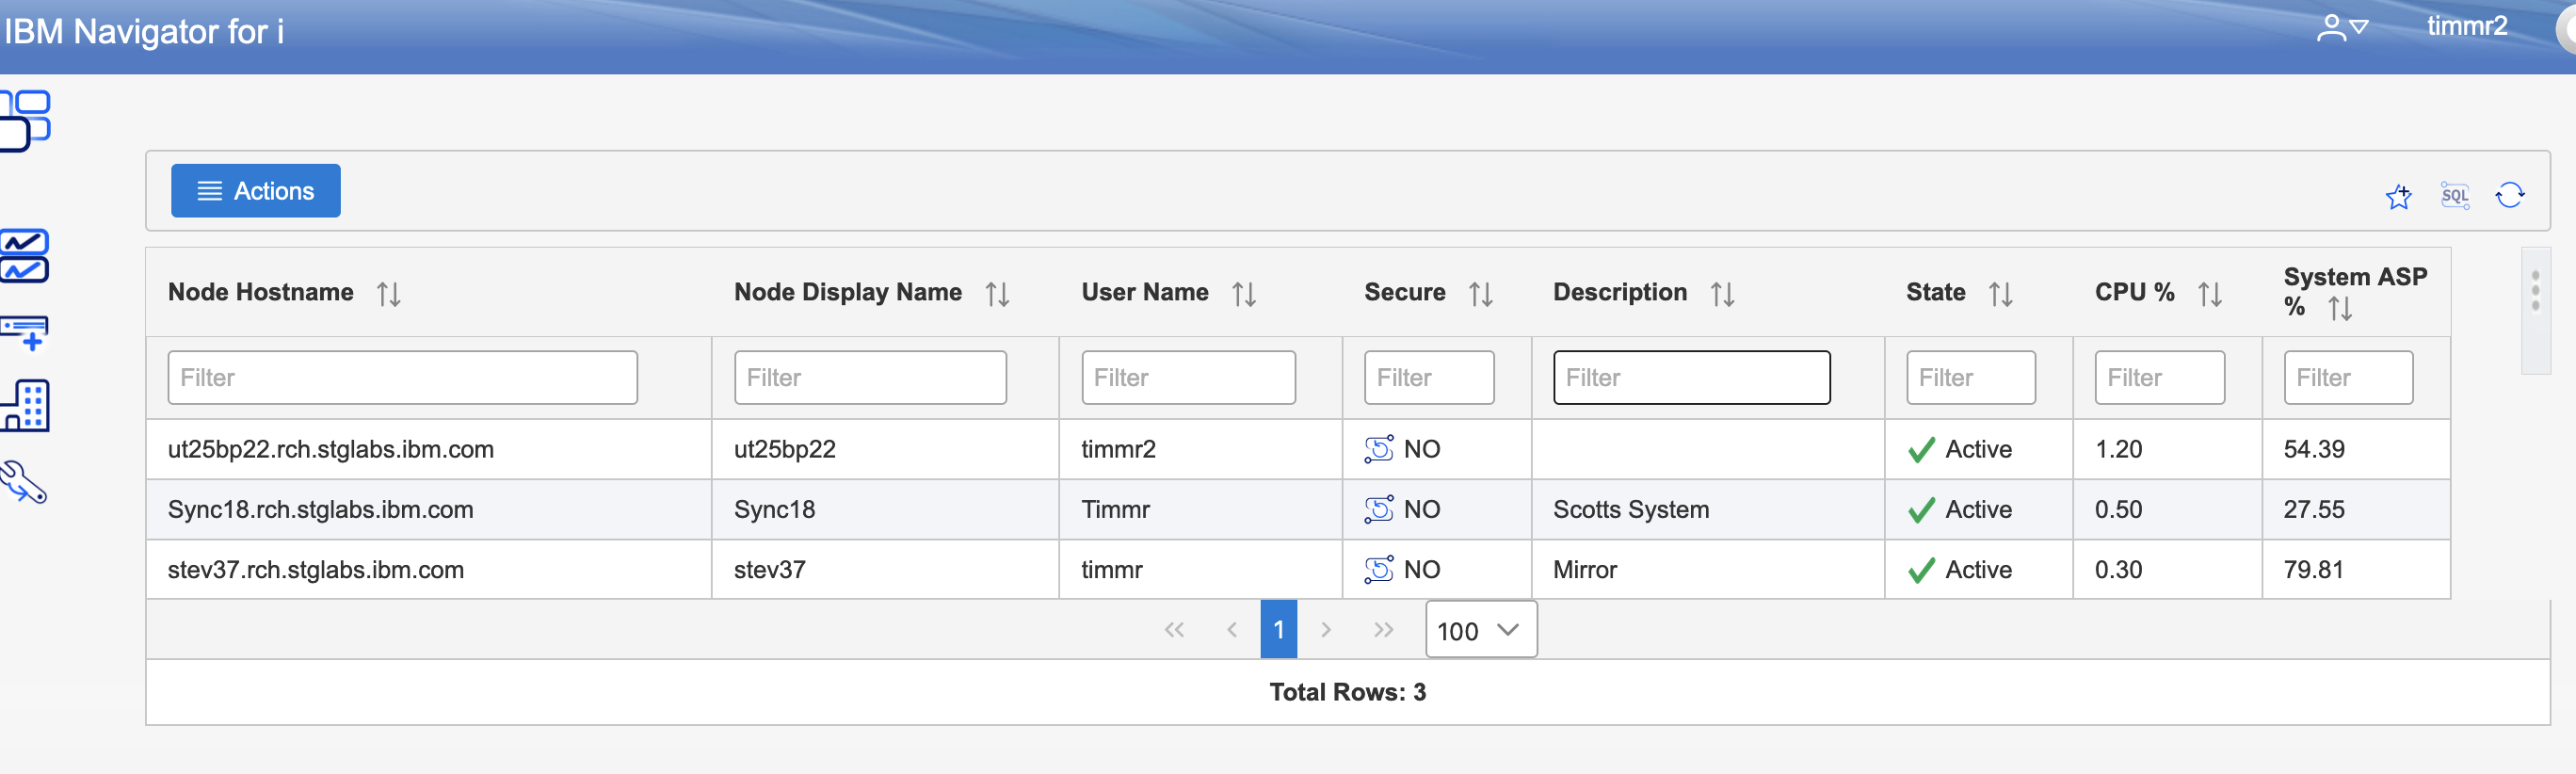
The list view provides the same system health information but in a rich table format. All columns can be used to reorder the data in the table. Each column has a filter field to help easily identify the system you want to monitor or manage.
The list view for the dashboard also provides actions for import and export. These actions are helpful for setting up a large number of systems and for setting up the navigator system dashboard list for multiple users. The "Export" action creates a JSON file that has all the system paths and access controls (either secured or non-secured). There is NO authorization information saved. When another user signs in to the Navigator, they are able to import the list of systems from this JSON file, but are required to provide their own authorization information.
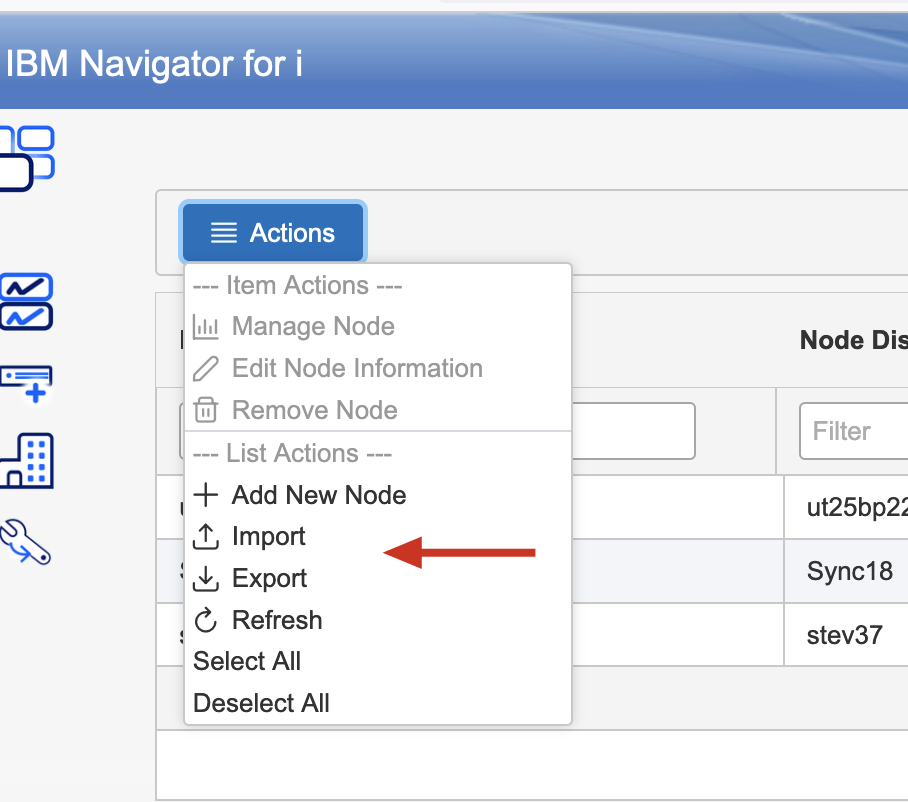
Note, the "Import" action can be used to add more system to a user dashboard or to reload all the systems on the dashboard for the signed-in user.
Was this topic helpful?
Document Information
Modified date:
20 December 2024
UID
ibm16483563