Question & Answer
Question
How do I collect debugging information for errors in the IBM Security Guardium GUI portal?
Answer
Use the following CLI command to collect Application Debugging information:
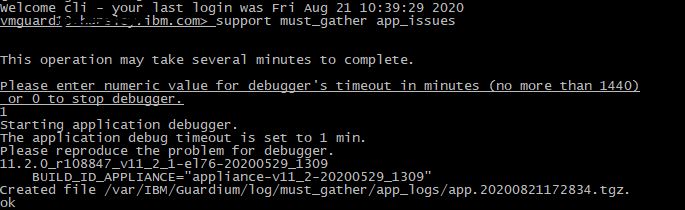
support must_gather app_issuesThis command will ask how long (in Minutes) you'd like to run the debug Utility. Select enough time to reproduce the application error. (For example, if you know that the problem reproduces in 20 minutes, choose to run the Utility for 30 minutes). Once the debugger is started, please reproduce the issue while its running.
After the elapsed time a file will be created:
/var/IBM/Guardium/log/must_gather/app_logs/app.<date>.tgzExample:
You may use fileserver to retrieve this file from the appliance and send to IBM Guardium Support.
Related Information
[{"Type":"MASTER","Line of Business":{"code":"LOB76","label":"Data Platform"},"Business Unit":{"code":"BU048","label":"IBM Software"},"Product":{"code":"SSMPHH","label":"IBM Security Guardium"},"ARM Category":[{"code":"a8m0z0000000AqcAAE","label":"GUI"}],"ARM Case Number":"","Platform":[{"code":"PF016","label":"Linux"}],"Version":"and future releases;11.5.0;12.0.0"}]
Was this topic helpful?
Document Information
Modified date:
09 June 2026
UID
swg21607130