Running an Analysis
If you have any add-on options, the Analyze menu contains a list of reporting and statistical analysis categories.
We will start by creating a simple frequency table (table of counts). This example requires Statistics Base Edition.
- From the menus choose:
The Frequencies dialog box is displayed.
Figure 1. Frequencies dialog box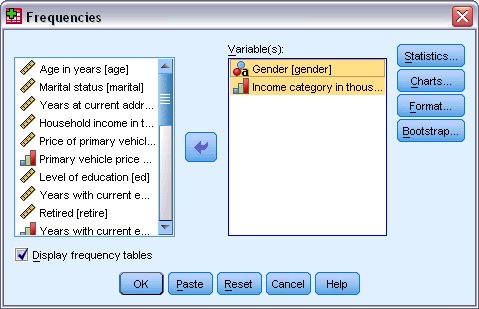
An icon next to each variable provides information about data type and level of measurement.
Numeric String Date Time Scale (Continuous) 
n/a 

Ordinal 


Nominal 


If the variable label and/or name appears truncated in the list, the complete label/name is displayed when the cursor is positioned over it. The variable name inccat is displayed in square brackets after the descriptive variable label. Income category in thousands is the variable label. If there were no variable label, only the variable name would appear in the list box.
You can resize dialog boxes just like windows, by clicking and dragging the outside borders or corners. For example, if you make the dialog box wider, the variable lists will also be wider.
In the dialog box, you choose the variables that you want to analyze from the source list on the left and drag and drop them into the Variable(s) list on the right. The OK button, which runs the analysis, is disabled until at least one variable is placed in the Variable(s) list.
In many dialogs, you can obtain additional information by right-clicking any variable name in the list and selecting Variable Information from the pop-up menu.
- Click Gender [gender] in the source variable list and drag the variable into the target Variable(s) list.
- Click Income category in thousands [inccat] in the source list
and drag it to the target list. Figure 2. Variables selected for analysis
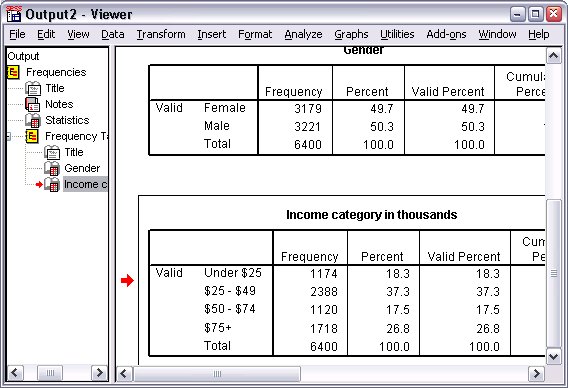
- Click OK to run the procedure.
Results are displayed in the Viewer window.