Feature Space
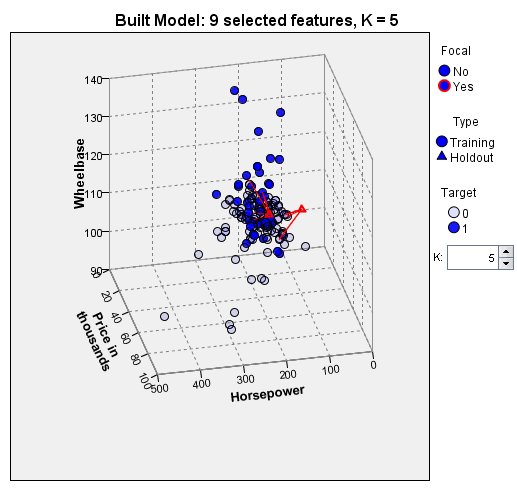
With the addition of a target variable, weighting by importance, and k selection, the feature space looks a little different from before.
- The color of a point indicates the value of the target for that case. A glance at the distribution of color in the chart tells you that cars and trucks are fairly well separated in the feature space.
- With weighting by importance, the variables shown by default in the feature space are not exactly the same; Engine size [engine_s] has been replaced by Wheelbase [wheelbas].
- Automatic k selection has chosen 5 as the "best" number of nearest neighbors.
The prototypes appear to be closest to vehicles of their own type, but for more detail, look at the Peers charts.