Visualizations in Planning Analytics Workspace
You can use any of the visualizations that are described here to present data in Planning Analytics Workspace.
To change the visualization type for any view in a book:
- Click the view.
- Click the Change visualization icon. The label next to the icon indicates
the type of visualization that is currently displayed for the view.
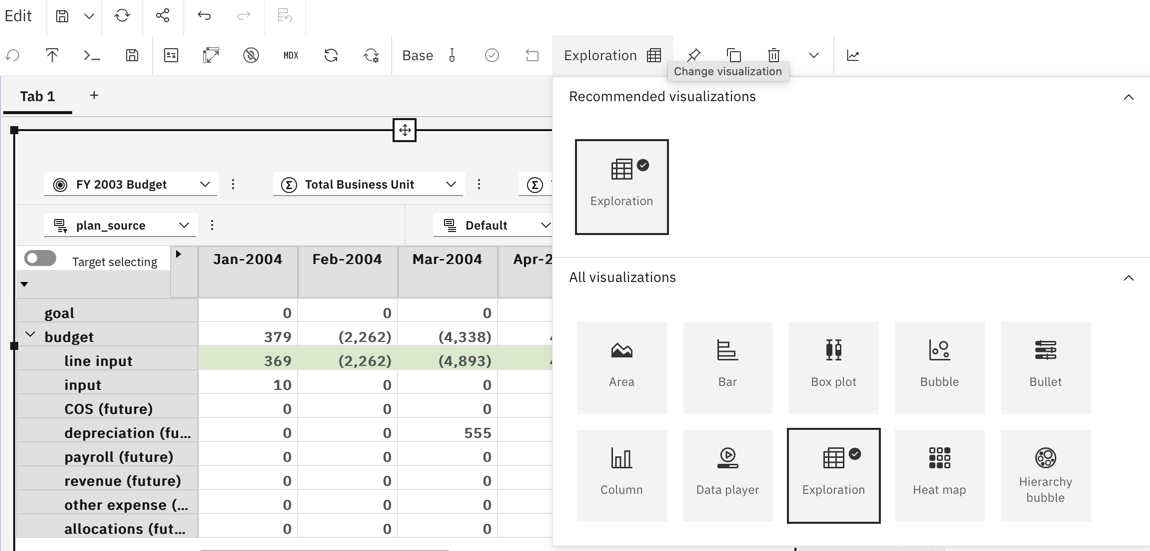
- Under All visualizations, select the visualization that you want to apply to the view.
Note: When
you convert a view to a visualization, if Planning Analytics Workspace cannot find a mapped member,
the first member in the current set is automatically reassigned to the missing mapped member's field
slot in order to display the selected visualization. This can occur if a mapped member was removed
from the data as a result of the following:
- A change to the set (dynamic or static) such as a synchronization event
- View actions such as zero suppression, calculation removal, and more
- Insufficient permissions in the view. For example, if User1 creates a view that includes members for which User2 does not have at least Read permission.
You might still see a blank visualization if :
- a substitute member is not available
- synchronization forces the visualization to use the missing mapped member
- the field slot is reassigned to a substitute member but you force the visualization to use the missing mapped member by selecting it from the member selector menu
You can also drag a cube or a view from the data tree onto an
existing visualization to replace the visualization. The visualization updates based on the view you
drop.
Note: Replacing the visualization resets any previous visualization properties and fields that
you manually selected or added.
When you right-click a visualization member, you see the full abbreviated value of the member, along with several options to interact with the visualization.
- Hide
- Hide the member in the visualization.
- Unhide all
- Reveal all hidden members in the visualization.
- Drill up
- Collapse the member to show its immediate parent.
- Drill down
- Reveal the members of a consolidation. You cannot drill down on a leaf member.
To hide totals in a visualization, click the Hide all totals button on the toolbar, then turn on the Hide all totals option.
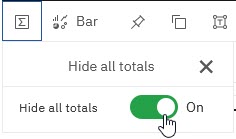
To restore totals in the visualization, turn off the Hide all totals option.