The Output tabs
Describes how the IDE output tabs reflect the result of project execution.
After you execute a run configuration, the solving engine searches for the optimal solution, and when execution is complete, the IDE displays several output tabs in the main window.
These tabs are:
Problems
The Problems tab displays semantic and syntax errors as you type when you write a model manually, and internal errors, such as scripting or algorithm errors, when you solve a model.
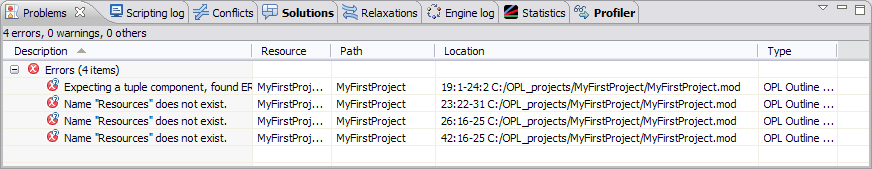
How to read messages:
The Description column guides the user as to the nature of the error.
The Resource column indicates which resource the error occurred in.
The Path column provides the path to the current file.
The Location column reflects the line that’s affected by the error.
Scripting Log
The Scripting log tab shows execution output related to the IBM® ILOG® Script main or execute or prepare blocks of the model (if applicable).
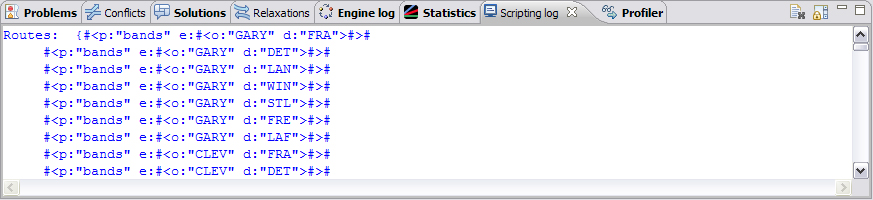
Solutions
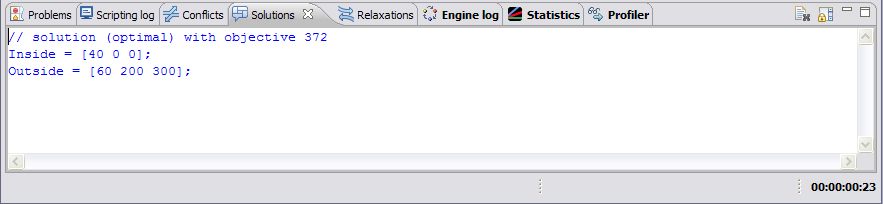
The Solutions tab displays the final solution to a model and, if applicable, any intermediate feasible solutions found.
The variables are displayed as well by default, but you can disable this display, see OPL language options in the IDE Reference.
CPLEX® solution quality
CPLEX solution quality information is available on the Solutions tab. You will see an additional report such as:
// Quality Incumbent solution:
// MILP objective                                3.8300000000e+002
// MILP solution norm |x| (Total, Max)           1.40000e+001 1.00000e+000
// MILP solution error (Ax=b) (Total, Max)       0.00000e+000 0.00000e+000
// MILP x bound error (Total, Max)               0.00000e+000 0.00000e+000
// MILP x integrality error (Total, Max)         0.00000e+000 0.00000e+000
// MILP slack bound error (Total, Max)           0.00000e+000 0.00000e+000
//
// Branch-and-cut subproblem optimization:
// Max condition number:             4.2500e+001
// Percentage of stable bases:       100.0%
// Percentage of suspicious bases:   0.0%
// Percentage of unstable bases:     0.0%
// Percentage of ill-posed bases:    0.0%
The details of the MIP problem report can be controlled by using the OPL parameter mipkappastats. See MIP kappa computation in the Parameters Reference Manual.
Example of preprocessing scripting:
execute {cplex.mipkappastats = 2;}
Conflicts
When a CPLEX model proves infeasible, the Conflicts tab shows the places where you can change the data or the way filtering constraints are expressed in order to remove the incompatibilities that made the model infeasible. See Relaxing infeasible models in IDE Tutorials for details.
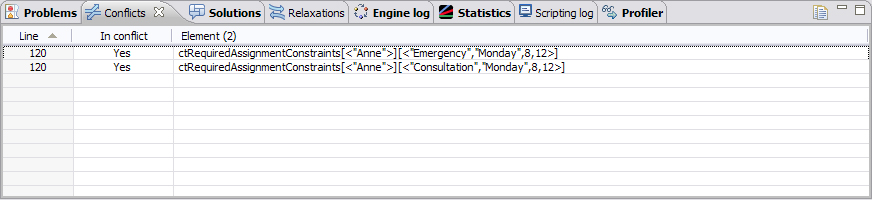
The Conflicts tab is empty after execution of product.mod because that project is not designed as infeasible.
Relaxations
When a CPLEX model proves infeasible, the Relaxations tab shows the places that constraints can be relaxed to remove the incompatibilities that made the model infeasible. See Relaxing infeasible models in IDE Tutorials for details.
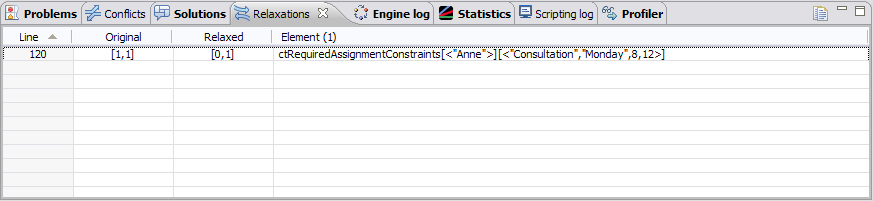
The Relaxations tab is empty after execution of product.mod because that project is not designed as infeasible.
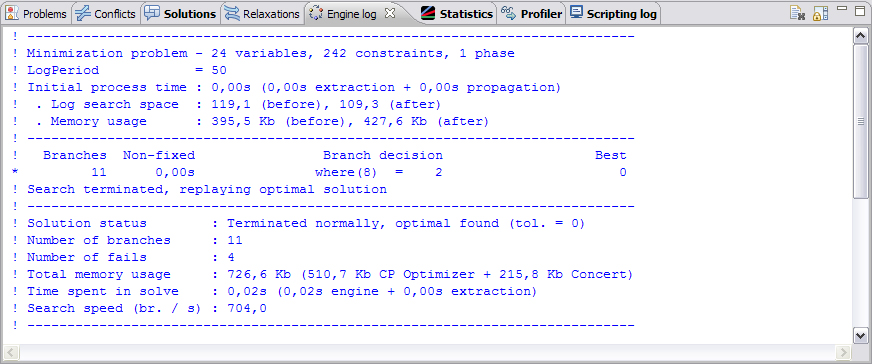
Engine Log
The Engine Log tab displays information from the solving engine (CPLEX for product.mod) on the solving process and on the objective function (in this example, a minimize statement).
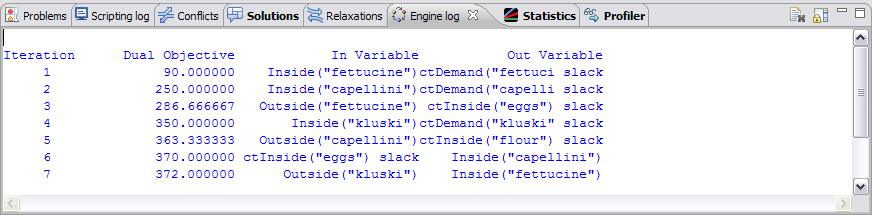
CPLEX users may recognize this information as what they see when executing CPLEX Interactive.
For comparison, the Engine Log for a constraint programming model looks like this:
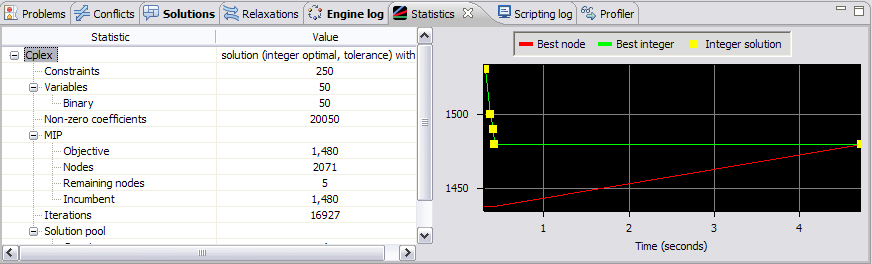
Statistics
The Statistics tab shows details of the algorithm used by the solving engine.
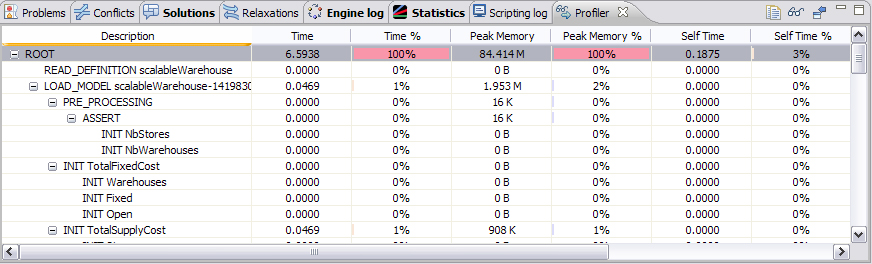
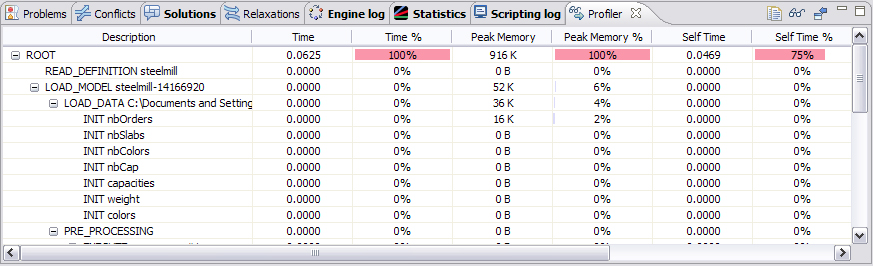
Profiler
The profiling tool computes the time and memory used by each execution step listed in the Description tree on the right and displays it as a table in the Profiler tab of the Output Area. You can use this information to improve the model so that it executes faster and consumes less memory. The Profiler table also displays details of model extraction and engine search during the solving phase. See Profiling the execution of a model in IDE Tutorials.