Visualization application page
In IBM® API
Connect, you can
use existing visualizations or create your own visualizations to organize the data on your
dashboards.
You can access the visualizations application page by selecting Analytics in the navigation for a Catalog. Select to open the Visualization page.
The visualization landing page displays a table with the following information:
- Name
- The name of the visualization. The names of the default visualizations are based on the information that is contained within the visualization. This list contains both preconfigured visualizations and customized visualizations.
- Type
- The format of the data in the visualization.
- Tags
- Tags that identify at what level the visualization was created, and the required access level
that is required to change them. The following tags are supported:
- admin
- This visualization is provided with IBM API
Connect. You cannot modify
visualizations with the
admintag. You must clone them if you want to customize them. - catalog
- This visualization was created by someone with catalog management permissions. You can only
modify visualizations with the
catalogtag if you have catalog management permissions. If you only have space permissions, then you must clone it to modify it. - space
- This visualization was created by someone with space management permissions. You can only modify
visualizations with the
spacetag if you have space management permissions.
The screen elements of the visualize application page
The following image shows an example of the visualizations for the Sandbox Catalog with sample
data. Custom visualizations that you create for Catalogs or Spaces, and the
Analytics visualizations for other entities such as Products, Plans, and APIs, have a similar
layout.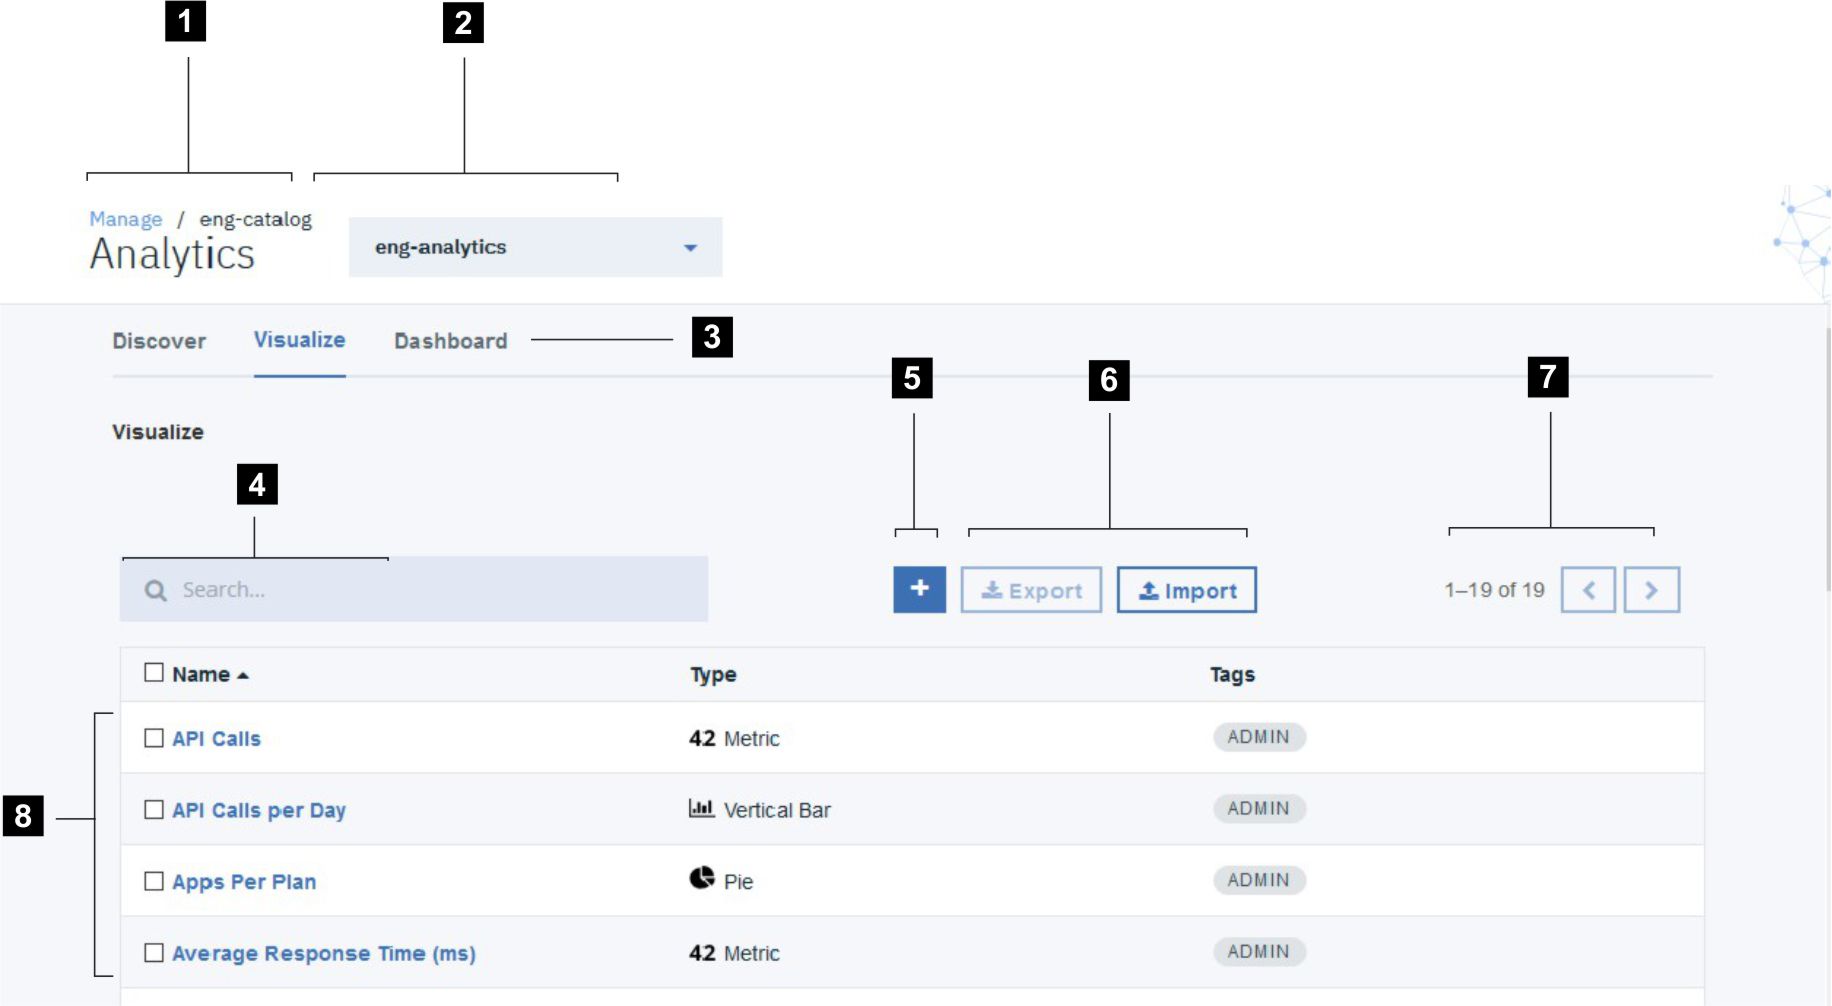
The screen elements are summarized in the following table.
| Screen element | Description |
|---|---|
| 1 Catalog or Space name | Identifies the selected Catalog or Space. |
| 2 Service identifier | Identifies the analytics service that you are viewing. If you only have one analytics service configured, there is only one possible value. |
| 3 Application selector | Indicates your selected application inside the analytics tab navigation. You can select a different application name to view the information for that application. |
| 4 Search bar | Use this bar to filter your visualizations for the Catalog or Space. |
| 5 Create a visualization | Use this icon to create a customized visualization. See Creating visualizations. |
| 6 Visualization configuration icons | Import or export your visualization to integrate a visualization or share one. |
| 7 Navigation icons | Use these icons to navigate through a large number of visualizations that require multiple screens. Each screen displays a maximum of 20 visualizations. |
| 8 Visualization information | Names and information about the saved visualizations for this Catalog or Space. |