Predicted Values
Four new variables have been created in the active dataset:
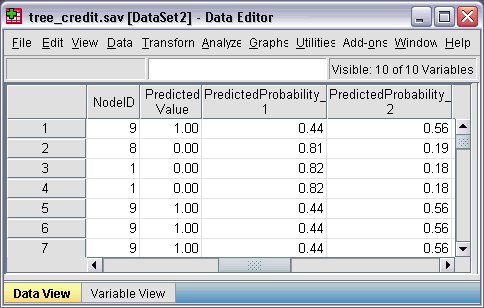
NodeID. The terminal node number for each case.
PredictedValue. The predicted value of the dependent variable for each case. Since the dependent variable is coded 0 = Bad and 1 = Good, a predicted value of 0 means that the case is predicted to have a bad credit rating.
PredictedProbability. The probability that the case belongs in each category of the dependent variable. Since there are only two possible values for the dependent variable, two variables are created:
- PredictedProbability_1. The probability that the case belongs in the bad credit rating category.
- PredictedProbability_2. The probability that the case belongs in the good credit rating category.
The predicted probability is simply the proportion of cases in each category of the dependent variable for the terminal node that contains each case. For example, in node 1, 82% of the cases are in the bad category and 18% are in the good category, resulting in predicted probabilities of 0.82 and 0.18, respectively.
For a categorical dependent variable, the predicted value is the category with the highest proportion of cases in the terminal node for each case. For example, for the first case, the predicted value is 1 (good credit rating), since approximately 56% of the cases in its terminal node have a good credit rating. Conversely, for the second case, the predicted value is 0 (bad credit rating), since approximately 81% of cases in its terminal node have a bad credit rating.
If you have defined costs, however, the relationship between predicted category and predicted probabilities may not be quite so straightforward. See the topic Assigning Costs to Outcomes for more information.