Assigning Costs to Outcomes
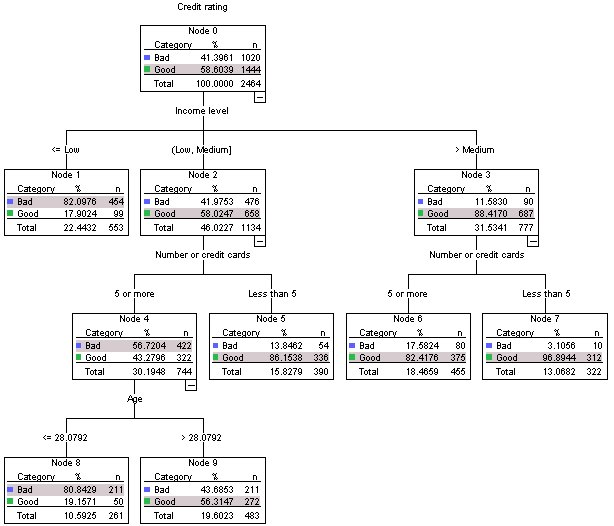
As noted earlier, aside from the fact that almost half of the cases in node 9 fall in each credit rating category, the fact that the predicted category is "good" is problematic if your main objective is to build a model that correctly identifies bad credit risks. Although you may not be able to improve the performance of node 9, you can still refine the model to improve the rate of correct classification for bad credit rating cases—although this will also result in a higher rate of misclassification for good credit rating cases.
First, you need to turn off case filtering so that all cases will be used in the analysis again.
- From the menus choose:
- In the Select Cases dialog box, select All cases, and then click OK.
Figure 2. Select Cases dialog box 
Figure 3. Decision Tree dialog box 
- Open the Decision Tree dialog box again, and click Options.
- Click the Misclassification
Costs tab.
Figure 4. Options dialog box, Misclassification Costs tab 
- Select Custom, and for Bad Actual Category
/ Good Predicted Category, enter
a value of 2.
This tells the procedure that the "cost" of incorrectly classifying a bad credit risk as good is twice as high as the "cost" of incorrectly classifying a good credit risk as bad.
- Click Continue, and then in the main dialog box, click OK to run the procedure.

At first glance, the tree generated by the procedure looks essentially the same as the original tree. Closer inspection, however, reveals that although the distribution of cases in each node hasn't changed, some predicted categories have changed.
For the terminal nodes, the predicted category remains the same in all nodes except one: node 9. The predicted category is now Bad even though slightly more than half of the cases are in the Good category.
Since we told the procedure that there was a higher cost for misclassifying bad credit risks as good, any node where the cases are fairly evenly distributed between the two categories now has a predicted category of Bad even if a slight majority of cases is in the Good category.
This change in predicted category is reflected in the classification table.

- Almost 86% of the bad credit risks are now correctly classified, compared to only 65% before.
- On the other hand, correct classification of good credit risks has decreased from 90% to 71%, and overall correct classification has decreased from 79.5% to 77.1%.
Note also that the risk estimate and the overall correct classification rate are no longer consistent with each other. You would expect a risk estimate of 0.229 if the overall correct classification rate is 77.1%. Increasing the cost of misclassification for bad credit cases has, in this example, inflated the risk value, making its interpretation less straightforward.