Defining column dependencies
Define column dependencies to ensure that the fact data is aggregated correctly based on the keys or attributes of those keys that are used in the query.
The column dependency groups are related to each other in a hierarchy group in an order from coarse to fine granularity.
About this task
You do not need to specify column dependencies for all tables. Do it only when double-counting would take place. Your decision to specify column dependencies affects other Cognos® Analytics components, such as reports or dashboards.
Procedure
-
From the table context (right-click) menu
 , select Specify column dependencies.
The Column dependencies
 view is opened.
 -
Click the group icon
 , and draw a line from the highest level attribute to the left of the next level
attribute. Group the columns in a logical order to create a hierarchy group.
, and draw a line from the highest level attribute to the left of the next level
attribute. Group the columns in a logical order to create a hierarchy group.
Repeat this action for each level until the hierarchy is complete from coarse to fine granularity.
Results
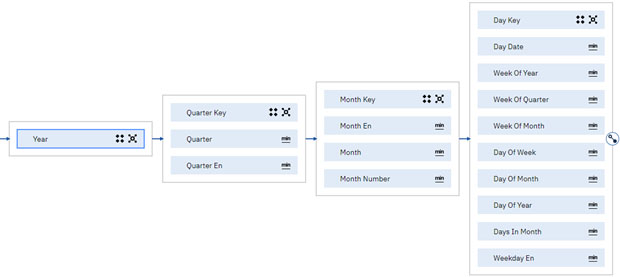
The following scenario 1 example shows how to group hierarchy columns and add their attributes in a denormalized table that includes facts at different levels of granularity.
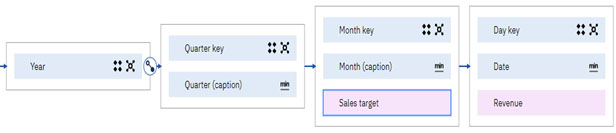
The following scenario 2 example shows column
dependencies in a Time dimension table that can relate to multiple fact
tables at different levels of granularity. You can see how columns in the
Time dimension can be grouped, and their attributes added. In this case, the
Time dimension is joined to the Sales Target fact
table on the Month Key, and to the Sales fact table on the
Day Key. The hierarchy for the Time dimension table is
specified and configured to prevent double counting when a query includes the Day
Key level and the Sales Target fact, which would repeat for every day in
the month.
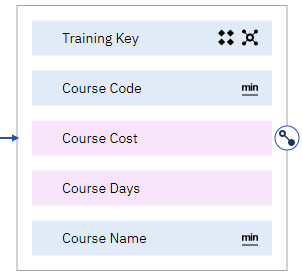
The following scenario 3 example shows how column
dependencies can be defined when a dimension table contains measures. The column dependency is built
around the unique Training Key column. All other columns are nested underneath as
attributes of the Training Key column. In this case, there is no hierarchy in the
dimension data so only one dependency group is defined.