Column dependencies
Use the column dependency feature to clarify data granularity in a table or view to avoid double-counting of repeated values when data is aggregated.
Column dependencies are created automatically when the source tables are added to the data module. When a calculated column, which is based on columns that exist in the automatically generated column dependency, is created, the column is added to the generated column dependency. However, if a new column is pulled into the data module from the source data tree, the column is not added to the automatically generated column dependencies, and causes a validation error. In this case, the column dependency for the data module must be updated manually.
Column dependency is an equivalent of determinants in Framework Manager. However, column dependency provides more flexibility because you can specify more than one hierarchy per table, view, query subject, or data set. For more information, see Determinants.
There are three common scenarios, described in the following sections, where double-counting can occur. In each scenario, you need to specify column dependencies to avoid double-counting. Remember to always check or review your column dependencies when you test for expected results.
Scenario 1
In this scenario, a table contains replicated data (denormalized table).
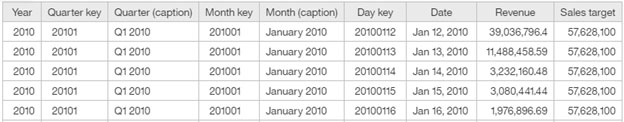
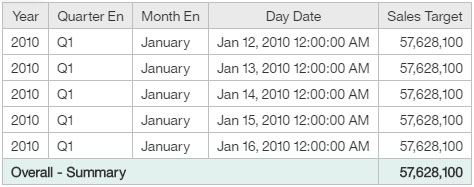
For example, in the following table that contains Revenue at the day level and Sales target at the month level, the values for Sales target are repeated for each day of a month.
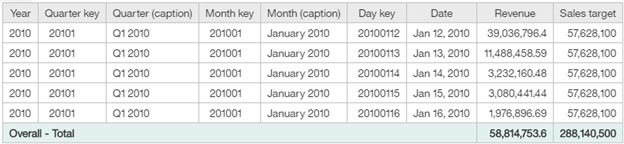
Before column dependencies are applied, the Sales target total value is shown as 288,140,500, which is incorrect.
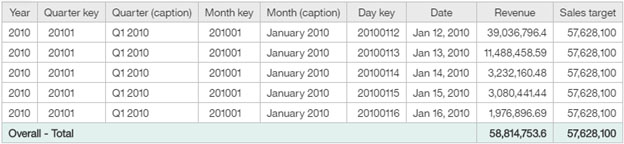
After column dependencies are applied, the Sales target total value is shown as 57,628,100, which is correct.
Scenario 2
This scenario involves joining on a key at a higher level of granularity in dimension tables. A dimension table on the 1..1 or 0..1 side of a relationship, containing attributes, is joined to a fact table on the 1..n or 0..n side of a relationship. The columns in the dimension table have repeating values.
In the following example, a Time dimension table that contains data for each calendar date is joined, by using the Month Key, to a fact table that contains the Sales Target data at the month level.

When a query is created that displays the calendar date values together with the Sales Target data, the values for each month are returned for every date value. The result is an aggregated Sales Target summary value of 288,140,500, which is inflated by a factor equal to the number of days in the month.
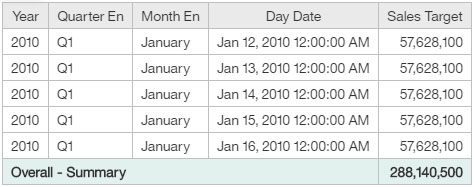
After column dependencies are applied, the Sales Target summary value is shown as 57,628,100, which is the expected value.
Scenario 3
In this scenario, measures in a dimension table are involved.
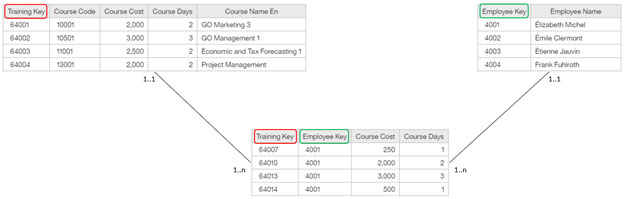
In the following example, the table Employee Training dim (on the left) contains the measures Course Cost and Course Days. The same measures exist in the Employee Training Fact table. The Employee Training dim table is joined to the Employee Training Fact table on the Training Key field. The Employee Dim table (on the right), which introduces more granularity, is joined to the Employee Training Fact table on the Employee Key field. When queries are created that are based on these three tables, there is a danger of double-counting the measures in the Employee Training dim table.
When querying across all three tables, you might want to see the Course Cost and Course Days measures aggregated for both the course granularity and the employee granularity. The following report output shows how you can achieve this effect by using the column dependencies feature.
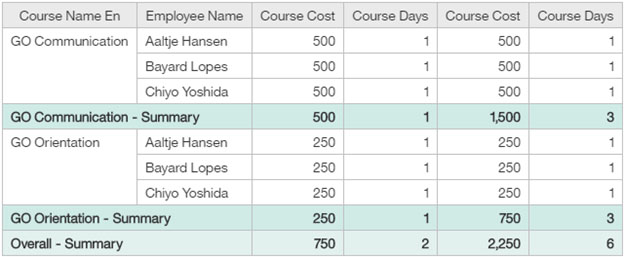
With the column dependencies defined, the first Course Cost and Course Days measures are not double-counted in the Course Name En summary row. However, the second instances of these measures, from the Employee Training Fact table, are aggregated for each employee within the Course Name En grouping. In the Overall - Summary row, the Course Cost for the two courses is shown as 750, and the revenue that was generated by all the students who took the course as 2,250.