User interface overview
This topic shows you a few of the major areas of the IBM® Planning Analytics for Microsoft Excel user interface
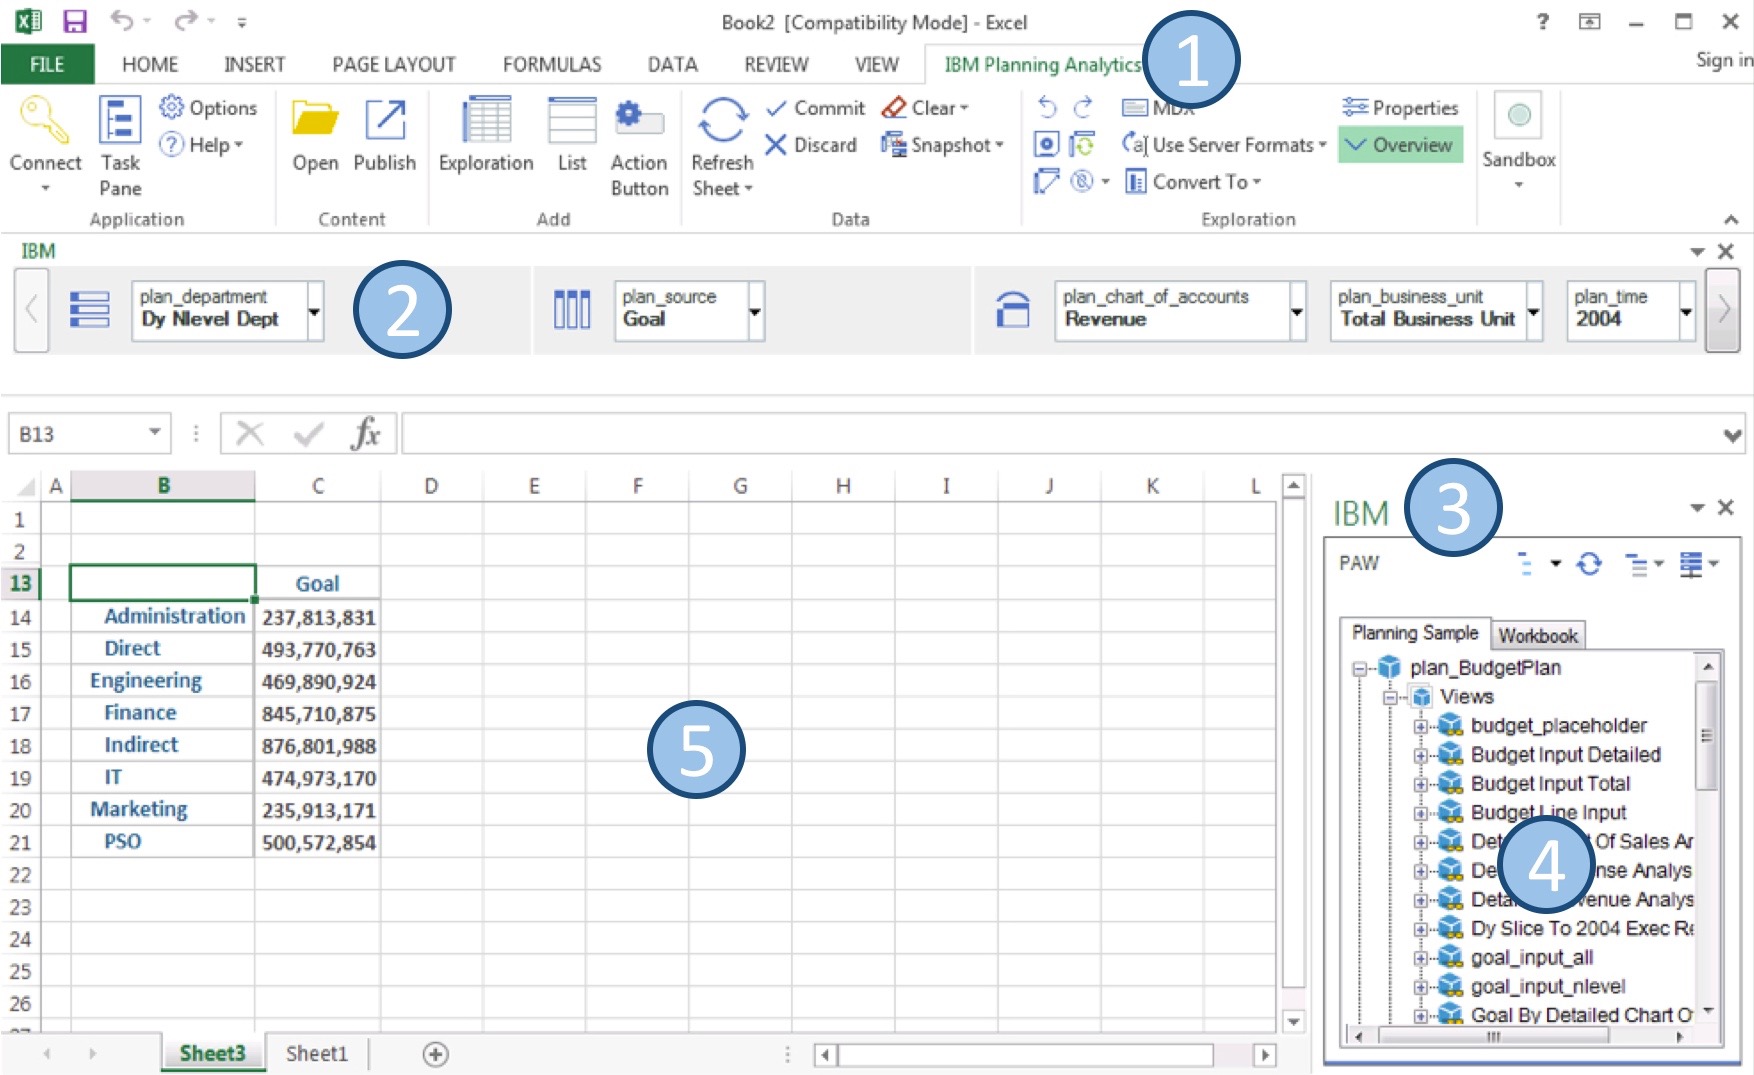
The following legend describes the areas that are referenced in the previous image:
The IBM Planning Analytics ribbon contains ribbon groups, which you can use to explore your data in Planning Analytics for Microsoft Excel.
-
Getting Started
The Getting Started group contains buttons, which you can use to connect to your datasource, view your data in a tree, set options, and find additional help.- Connect: The Connect button allows you to add or select a datasource. For more information, see Connecting to datasources.
- Task Pane: The Task Pane button allows you to access the source tree, controls for opening datasources, and active workbooks. For more information, see IBM task pane.
- Options: The Options button allows you to see the options that you can set in Planning Analytics for Microsoft Excel. For more information, see IBM Planning Analytics settings.
- Help: The Help button allows you to find additional help content related to Planning Analytics for Microsoft Excel.
-
Content
The Content group contains buttons, which you can use to open and publish your workbooks.- Open: The Open button allows you to find and open a workbook. For more information, see Opening workbooks from the TM1 Server Application folder.
- Publish: The Publish button allows you to publish your workbooks. For more information, see Share your analysis.
-
Add
The Add group contains buttons, which you can use to add Explorations, Lists, or Action Buttons to your worksheet.- Exploration: The Exploration button allows you to add an Exploration View to your worksheet. For more information, see Create an Exploration View from scratch.
- List: The List button allows you to add a List View to your worksheet. For more information, see Create a list.
- Action Button: The Action Button button allows you to add an Action Button to your worksheet. For more information, see Action buttons.
-
Data
The Data group contains buttons, which you can use to explore, refresh, or modify your workbook.- Refresh: The Refresh button allows you to refresh your worksheet. For more information, see Refresh data.
- Commit: The Commit button allows you to commit
changes in your Exploration View or Quick Report to the TM1 Server.
For more information about committing changes in a Quick Report, see Commit data in a Quick Report.
For more information about committing changes in an Exploration View, see Commit data in a TM1 Exploration View.
- Discard: The Discard button allows you to reset the values in a sandbox that you have changed, but not committed. For more information, see Virtual sandbox dimensions
- Design Mode: The Design Mode button allows you to enable or disable the automatic refreshing of an Exploration. For more information, see Design Mode.
- Clear: The Clear button allows you to clear data from your workbook or worksheet. For more information, see Clearing data.
- Snapshot: The Snapshot button allows you to convert reports in a workbook into a snapshot. For more information, see Convert dynamic data to snapshots (static data).
- Drill Through: The Drill Through button allows you to perform a drill through on your data. Drilling through on a cell provides detailed data on the cell, and shows you information from the data source. You can drill through on cells in Exploration Views, Custom Reports, Quick Reports, and Dynamic Reports. For more information, see Drill through to detailed data
-
Report
The Report group contains buttons, which allows you to show or highlight your reports, and set report properties.- Show Report: The Show Report button opens the workbook tab in the Task Pane and selects the report that contains the highlighted cell. If the highlighted cell is not within a report, the Show Report button shows all of the reports in the current worksheet in the Task Pane.
- Properties: The Properties button can be used with Exploration Views and Quick Reports. The Properties button shows the properties of the report that contains the highlighted cell. If the highlighted cell is not contained within a report, the Properties button shows all of the reports in the current worksheet in the Task Pane.
- Highlight Report: The Highlight Report button highlights the report area of the highlighted cell, if the cell is contained within a report. The Highlight Report button can be used with Quick Reports. If the highlighted cell is not contained within a report, the Highlight Report button shows all of the reports in the current worksheet in the Task Pane.
-
Exploration
The Exploration group contains buttons, which you can use to work with your Exploration View or list. For more information on the Exploration group, see Exploration Views and lists.
-
Dynamic
The Dynamic group contains buttons, which you can use to work with your Dynamic Report. For more information on the Dynamic group, see The Dynamic ribbon group.
-
Sandbox
The Sandbox group contains buttons, which you can use to work with your sandboxes.- New: The New button allows you to create a new sandbox.
- Delete: The Delete button allows you to delete the current sandbox.
- Rename: The Rename button allows you to rename the current sandbox.
- Clone: The Clone button allows you to clone the current sandbox.
- Merge: The Merge button allows you to commit changes from your sandbox to the case. For more information, see Virtual sandbox dimensions.
-
The overview area is displayed when you are viewing an Exploration View or a list. Use the overview area as a convenient place to quickly explore and change the contents of the Exploration View or list.
For Exploration Views, the overview area displays the Rows, Columns, and Context areas. You populate the Exploration View with data by adding items from the data source to these areas. For example, you can place a Department dimension in the rows and a Source dimension in the columns. The items that you place in the context area are used to filter the values. For example, you can filter the Exploration View to display data for a specific year by selecting a year in the Time dimension. Each box in the rows, columns, and context area represents a set of data in the data source.
The IBM® task pane is a component in Planning Analytics for Microsoft Excel that provides you access to the source tree, controls for opening datasources, and active workbooks.
The source tree in the task pane displays the cube and related items of the data source, such as views.
The work area is Microsoft Excel worksheet where you create and view reports.
When you create a new Exploration View or list, the work area displays a visual guide to help you build the report. Drop zones show you where you can drag items from the source tree to create the report. You can change, limit, or expand the items that you see in an Exploration View by using techniques such as filtering and drilling, to quickly focus on the most significant items on your worksheet.
If you want to use a more flexible report layout, rather than visual guides, you can create other types of reports such as Quick Reports, Dynamic Reports, and Custom Reports.