Available Built-in Graphboard Visualization Types
You can create several different visualization types. All of the following built-in types are available on both the Basic and Detailed tabs. Some of the descriptions for the templates (especially the map templates) identify the fields (variables) specified on the Detailed tab using special text.
| Chart icon | Description | Chart icon | Description |
|---|---|---|---|
 |
Bar
Calculates
a summary statistic for a continuous numeric field and displays the
results for each category of a categorical field as bars. Requires: A categorical field and a continuous field. |
 |
Bar of Counts
Displays
the proportion of rows/cases in each category of a categorical field
as bars. You can also use the Distribution
graph node to produce this graph. That node offers some additional
options. See the topic Distribution Node for more information. Requires: A single categorical field. |
 |
Pie
Calculates
the sum of a continuous numeric field and displays the proportion
of that sum distributed in each category of a categorical field as
slices of a pie. Requires: A categorical field and a continuous field. |
 |
Pie of Counts
Displays
the proportion of rows/cases in each category of a categorical field
as slices of a pie. Requires: A single categorical field. |
 |
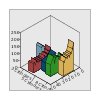
3-D Bar
Calculates
a summary statistic for a continuous numeric field and displays the
results for the crossing of categories between two categorical fields. Requires: A pair of categorical fields and a continuous field. |
 |
3-D Pie
This is
the same as Pie except with an additional 3-D effect. Requires: A categorical field and a continuous field. |
 |
Line
Calculates
a summary statistic for a field for each value of another field and
draws a line connecting the values. You
can also use the Plot graph node to produce a line plot graph. That
node offers some additional options. See the topic Plot Node for more information. Requires: A pair of fields of any type. |
 |
Area
Calculates
a summary statistic for a field for each value of another field and
draws an area connecting the values. The difference between a line
and area is minimal in that an area resembles a line with the space
colored below it. However, if you use a color aesthetic, this results
in a simple split of the line and a stacking of the area. Requires: A pair of fields of any type. |
 |
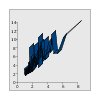
3-D Area
Displays
the values of one field plotted against the values of another and
split by a categorical field. An area element is drawn for each category. Requires: A categorical field and a pair of fields of any type. |
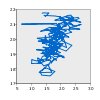 |
Path
Displays
the values of one field plotted against the values of another, with
a line connecting the values in the order they appear in the original
dataset. The ordering is the primary difference between a path and
a line. Requires: A pair of fields of any type. |
 |
Ribbon
Calculates
a summary statistic for a field for each value of another field and
draws a ribbon connecting the values. A ribbon is essentially a line
with 3-D effects. It is not a true 3-D graph. Requires: A pair of fields of any type. |
 |
Surface
Displays
the values of three fields plotted against the values of one another,
with a surface connecting the values. Requires : Three fields of any type. |
 |
Scatterplot
Displays
the values of one field plotted against the values of another. This
graph can highlight the relationship between the fields (if there
is one). You can also use the Plot graph
node to produce a scatterplot. That node offers some additional options.
See the topic Plot Node for more information. Requires: A pair of fields of any type. |
 |
Bubble plot
Like
a basic scatterplot, displays the values of one field plotted against
the values of another. The difference is that the values of a third
field are used to vary the size of the individual points. Requires: Three fields of any type. |
 |
Binned Scatterplot
Like
a basic scatterplot, displays the values of one field plotted against
the values of another. The difference is that similar values are binned
into groups and that the color or size aesthetic is used to indicate
the number of cases in each bin. Requires : A pair of continuous fields. |
 |
Hex Binned Scatterplot
See
the description of Binned Scatterplot. The difference is the shape
of the underlying bins, which are shaped like hexagons rather than
circles. The resulting hex binned scatterplot looks similar to the
binned scatterplot. However, the number of values in each bin will
differ between the graphs because of the shape of the underlying bins. Requires: A pair of continuous fields. |
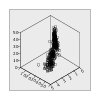 |
3-D Scatterplot
Displays
the values of three fields plotted against each other. This graph
can highlight the relationship between the fields (if there is one). You can also use the Plot graph node to produce
a 3-D scatterplot. That node offers some additional options. See
the topic Plot Node for more information. Requires: Three fields of any type. |
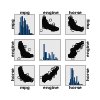 |
Scatterplot Matrix (SPLOM)
Displays
the values of one field plotted against the values of another for
every field. A SPLOM is like a table of scatterplots. The SPLOM also
includes a histogram of each field. Requires: Two or more continuous fields. |
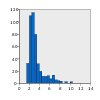 |
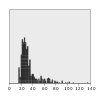
Histogram
Displays
the frequency distribution of a field. A histogram can help you determine
the distribution type and see whether the distribution is skewed. You can also use the Histogram graph node to
produce this graph. That node offers some additional options. See
the topic Histogram Plot Tab for more information. Requires: A single field of any type. |
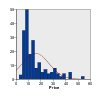 |
Histogram with Normal Distribution
Displays
the frequency distribution of a continuous field with a superimposed
curve of the normal distribution. Requires: A single continuous field. |
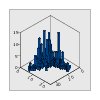 |
3-D Histogram
Displays
the frequency distribution of a pair of continuous fields. Requires : A pair of continuous fields. |
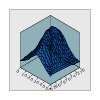 |
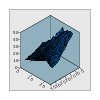
3-D Density
Displays
the frequency distribution of a pair of continuous fields. This is
similar to a 3-D histogram, with the only difference being that a
surface is used instead of bars to show the distribution. Requires: A pair of continuous fields. |
 |
Dot plot
Displays
the individual cases/rows and stacks them at the distinct data points
on the x axis. This graph is similar to a histogram in that
it shows the distribution of the data, but it displays each case/row
rather than an aggregated count for a specific bin (range of values). Requires : A single field of any type. |
 |
2-D Dot Plot
Displays
the individual cases/rows and stacks them at the distinct data points
on the y axis for each category of a categorical field. Requires: A categorical field and a continuous field. |
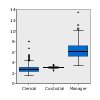 |
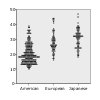
Boxplot
Calculates
the five statistics (minimum, first quartile, median, third quartile,
and maximum) for a continuous field for each category of a categorical
field. The results are displayed as boxplot/schema elements. The boxplots
can help you see how the distribution of continuous data varies among
the categories. Requires: A categorical field and a continuous field. |
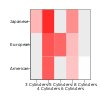 |
Heat map
Calculates
the mean for a continuous field for the crossing of categories between
two categorical fields. Requires : A pair of categorical fields and a continuous field. |
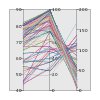 |
Parallel
Creates
parallel axes for each field and draws a line through the field value
for every row/case in the data. Requires: Two or more continuous fields. |
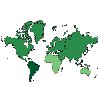 |
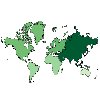
Choropleth of Counts
Calculates
the count for each category of a categorical field ( Data
Key) and draws a map that uses color saturation to represent
the counts in the map features that correspond to the categories. Requires : A categorical field. A map file whose key matches the Data Key categories. |
 |
Choropleth of Means/Medians/Sums
Calculates
the mean, median, or sum of a continuous field ( Color)
for each category of a categorical field (Data Key)
and draws a map that uses color saturation to represent the calculated
statistics in the map features that correspond to the categories. Requires: A categorical field and a continuous field. A map file whose key matches the Data Key categories. |
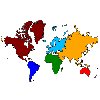 |
Choropleth of
Values
Draws a map that uses color to represent
values of a categorical field (Color) for the
map features that correspond to values defined by another categorical
field ( Data Key). If there are multiple categorical
values of the Color field for each feature, the modal value is used. Requires: A pair of categorical fields. A map file whose key matches the Data Key categories. |
 |
Coordinates on a Choropleth
of Counts
This is similar to Choropleth of Counts
except that there are two additional continuous fields (Longitude
and Latitude) that identify coordinates for
drawing points on the choropleth map. Requires: A categorical field and a pair of continuous fields. A map file whose key matches the Data Key categories. |
 |
Coordinates on
a Choropleth of Means/Medians/Sums
This is similar
to Choropleth of Means/Medians/Sums except that there are two additional
continuous fields ( Longitude and Latitude )
that identify coordinates for drawing points on the choropleth map. Requires : A categorical field and three continuous fields. A map file whose key matches the Data Key categories. |
 |
Coordinates on a Choropleth
of Values
This is similar to Choropleth of Values
except that there are two additional continuous fields (Longitude
and Latitude) that identify coordinates for
drawing points on the choropleth map. Requires: A pair of categorical fields and a pair of continuous fields. A map file whose key matches the Data Key categories. |
 |
Bars of Counts
on a Map
Calculates the proportion of rows/cases
in each category of a categorical field (Categories)
for each map feature (Data Key) and draws a
map and the bar charts at the center of each map feature. Requires: A pair of categorical fields. A map file whose key matches the Data Key categories. |
 |
Bars on a Map
Calculates
a summary statistic for a continuous field ( Values)
and displays the results for each category of a categorical field
(Categories ) for each map feature (Data
Key ) as bar charts positioned in the center of each map
feature. Requires: A pair of categorical fields and a continuous field. A map file whose key matches the Data Key categories. |
 |
Pie of Counts
of a Map
Displays the proportion of rows/cases
in each category of a categorical field ( Categories)
for each map feature ( Data Key) and draws
a map and the proportions as slices of a pie chart at the center of
each map feature. Requires: A pair of categorical fields. A map file whose key matches the Data Key categories. |
 |
Pie on a Map
Calculates
the sum of a continuous field (Values ) in
each category of a categorical field ( Categories)
for each map feature ( Data Key) and draws
a map and the sums as slices of a pie chart at the center of each
map feature. Requires: A pair of categorical fields and a continuous field. A map file whose key matches the Data Key categories. |
 |
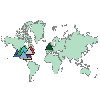
Line Chart on
a Map
Calculates a summary statistic for a continuous
field (Y) for each value of another field (X)
for each map feature (Data Key) and draws a
map and line charts connecting the values at the center of each map
feature. Requires: A categorical field and a pair of fields of any type. A map file whose key matches the Data Key categories. |
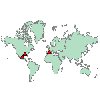 |
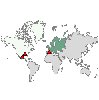
Coordinates on a
Reference Map
Draws a map and points using continuous
fields (Longitude and Latitude)
that identify coordinates for the points. Requires: A pair of range fields. A map file. |
 |
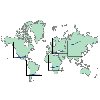
Arrows on a Reference
Map
Draws a map and arrows using continuous fields
that identify the start points (Start Long and Start
Lat) and end points (End Long and End
Lat) for each arrow. Each record/case in the data results
in an arrow in the map. Requires : Four continuous fields. A map file. |
 |
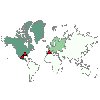
Point Overlay Map
Draws
a reference map and superimposes another point map over it with point
features colored by a categorical field (Color). Requires: A pair of categorical fields. A point map file whose key matches the Data Key categories. A reference map file. |
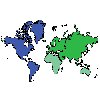 |
Polygon Overlay
Map
Draws a reference map and superimposes another
polygon map over it with polygon features colored by a categorical
field (Color). Requires: A pair of categorical fields. A polygon map file whose key matches the Data Key categories. A reference map file. |
 |
Line Overlay Map
Draws
a reference map and superimposes another line map over it with line
features colored by a categorical field (Color). Requires: A pair of categorical fields. A line map file whose key matches the Data Key categories. A reference map file. |