Graphboard appearance tab
You can specify appearance options before graph creation.
General appearance options
Title. Enter the text to use for the graph's title.
Subtitle. Enter the text to use for the graph's subtitle.
Caption. Enter the text to use for the graph's caption.
Sampling. Specify a method for larger datasets. You can specify a maximum dataset size or use the default number of records. Performance is enhanced for large datasets when you select the Sample option. Alternatively, you can choose to plot all data points by selecting Use all data, but you should note that this may dramatically decrease the performance of the software.
Stylesheet appearance options
There are two buttons that enable you to control which visualization templates (and stylesheets, and maps) are available:
Manage. Manage visualization templates, stylesheets, and maps on your computer. You can import, export, rename, and delete visualization templates, stylesheets, and maps on your local machine. See the topic Managing Templates, Stylesheets, and Map Files for more information.
Location. Change the location in which visualization templates, stylesheets, and maps are stored. The current location is listed to the right of the button. See the topic Setting the Location of Templates, Stylesheets, and Maps for more information.
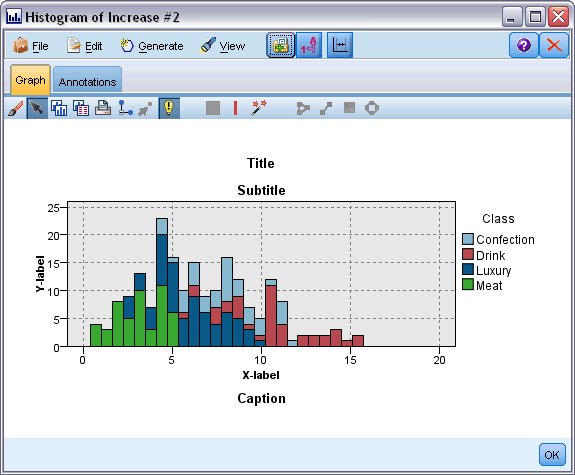
The following example shows where appearance options are placed on a graph. (Note that not all graphs use all these options.)