IBM Z® OMEGAMON® AI for JVM is a remote monitoring agent that discovers and solves problems within Java running on z/OS® operating systems. It is a part of the OMEGAMON family of software products.
With IBM Z OMEGAMON AI for JVM, you can monitor the performance of JVMs in different environments on z/OS, such as in CICS®, IMS, DB2® subsystems or in pure Java application servers like the WebSphere® Application Server or WebSphere Liberty Profile.
Integrate with other products within the OMEGAMON family to deliver seamless z/OS management capabilities.
Summary of features and updates for Z OMEGAMON AI for JVM
Detect online JVMs automatically to identify which Java workload is running and where.
Understand CPU usage at the Java thread level, including zIIP offload efficiency.
Analyze garbage collection and heap usage details to detect application memory leaks.
Enable IT teams to proactively identify common operational issues and define alert thresholds with OMEGAMON AI Insights.
Enable IT personnel to monitor critical z/OS Connect Enterprise Edition API requests and support the journey to the digital economy.
View all JVMs side-by-side, receive alerts for JVM performance issues, isolate the issue and quickly identify the root cause.
Monitor Java VMs on z/OS, including CICS®, Db2®, IMS, WebSphere®, Liberty and z/OS Connect Enterprise Edition API requests.
Learn how to:
- Discover Java performance problems.
- Identify Java heap and garbage collection problems.
- Identify the cause of throughput degradation.
- Check z/OS Connect EE API response times.
- Identify z/OS virtual storage issues.
Use your IBMid (or create a new ID) to access the 3-day trial.
Understand the current Java workload amount and where it is running in a single screen.
Detect thread and locking issues, sub-optimal JVM garbage collection, looping threads and CPU performance issues, including z/OS-specific resources such as zIIP offload and native memory allocation.
View the inflight and performance details of the completed z/OS Connect Enterprise Edition API Provider. With a single monitoring software, capture API calls initiated from a System of Record (API Requester).
Use native memory analysis to see how the overall address space memory is allocated and how it is consumed (threads, class libraries, heap, and so on). Monitor the free memory below and above the bar to avoid out-of-memory issues.
Gain insights into the overall CPU consumption of the address space, including zIIP offload and zIIP-eligible work that hasn't been offloaded. Enable mainframe support teams to optimize zIIP processor and CPU capacity.
Continue to monitor performance through product-provided situations to track CPU performance, garbage collection, JVM health metrics and z/OS Connect EE API workloads.
Simplify monitoring and management with a single view of the mainframe and subsystems. Use predefined dashboards populated with multi-level performance metrics to deliver effective user experience.
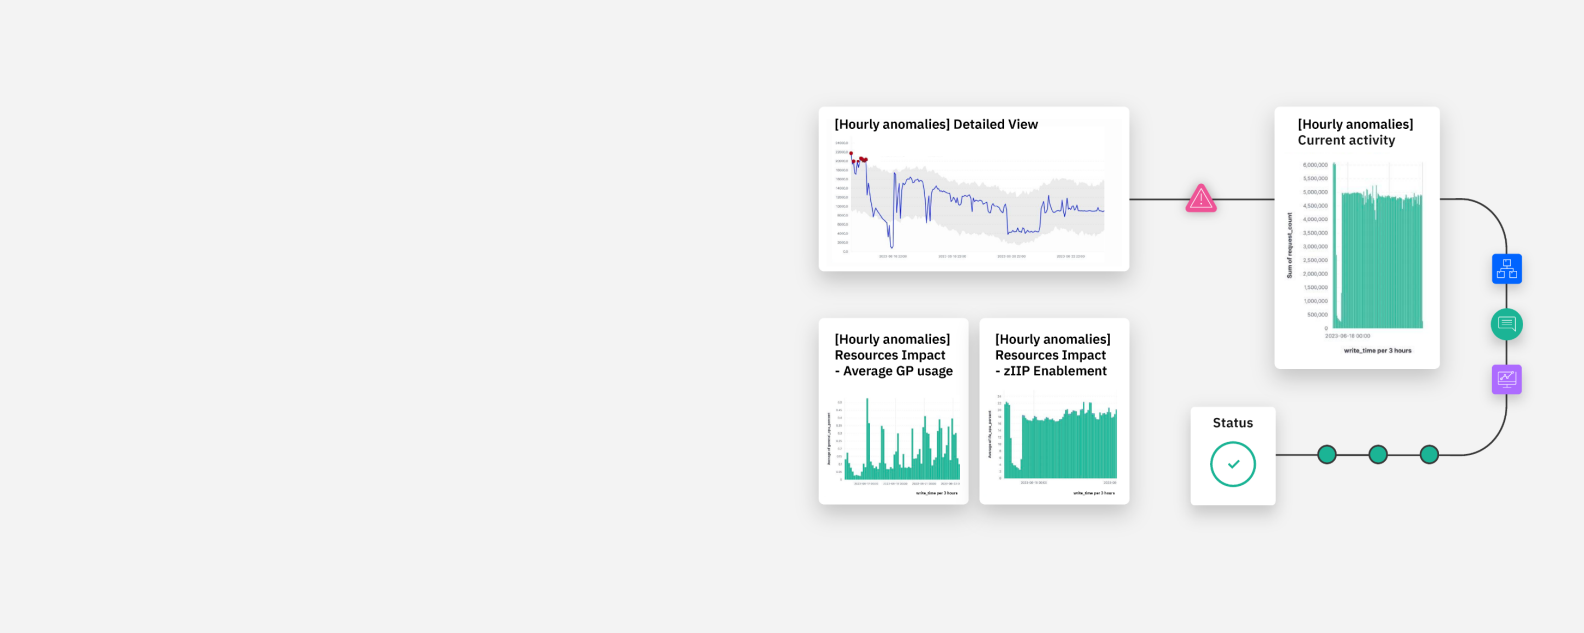
IBM Z OMEGAMON AI for JVM integrates with IBM Z OMEGAMON AI Insights, a diagnostic tool that helps identify and forecast the performance of z/OS system resources and applications. Use it as an AI/ML model to process a curated list of key performance indicators to identify anomalies that are indicative of poor performance and trends.
Use the IBM Z OMEGAMON Data Provider to help detect problems quickly, determine response and automate actions to remediate and prevent future occurrences.
IBM Z OMEGAMON Runtime Edition for JVM
Monitor the first few Java applications or z/OS Connect instances on z/OS
IBM Z OMEGAMON AI for JVM
Monitor all Java workloads on your entire mainframe
Licensing
Per active JVM instance licensing
Unlimited instance license
Usage
Flexibility to start small and expand
Freedom to discover and monitor all Java workloads on z/OS
Regular updates with valuable new functions
DevOps approach with monitoring Java on z/OS
Full IBM support
Product documentation
Deploy on any IBM Z processor capable of running z/OS V2.3.0 or later.
For detailed information about the software requirements, run a Software Product Compatibility Report for IBM Z OMEGAMON AI for JVM.
Use a comprehensive management suite to monitor, collaborate, automate and manage network and workloads in the z/OS environment.
Monitor and manage your z/OS environment with problem insights and open platform integration.
Use a single control point for a broad range of system management functions.