Analytics start-up issues on VMware
If you receive an error starting the Analytics service after installing, upgrading, or recovering from a catastrophic failure of IBM® API Connect on VMware, you might be able to resolve it by completing this task.
Uh oh! An error has occurred
In rare cases, the Kibana index can fail and the following message displays: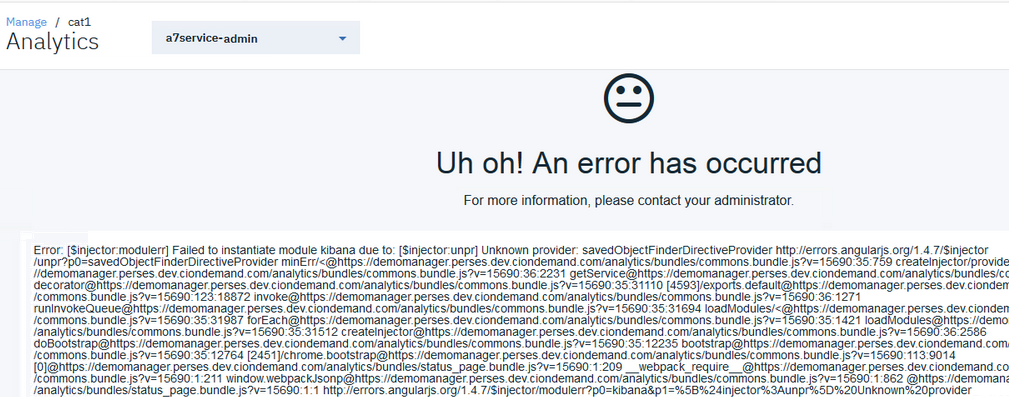
This error typically indicates that the index was corrupted. Complete the following steps to verify the problem and delete the corrupted index.
- SSH into the server:
- Run the following command to connect as the API Connect administrator, replacing
ip_addresswith the appropriate IP address:ssh ip_address -l apicadm - When prompted, select Yes to continue connecting.
- When you are connected, run the following command to receive the necessary permissions for
working directly on the appliance:
sudo -i
- Run the following command to connect as the API Connect administrator, replacing
- Get the names of a storage-coordinating pod and a client pod:
Determine the names of one of the deployment's storage-coordinating pods (called
analytics-storage-coordinating-podin the steps that follow) and one of the client pods (calledanalytics-client-podin the steps). To see the pod names, run the following command:kubectl get podsIn the following sample output, a storage-coordination pod is named
r70eaa1a0f2-analytics-storage-coordinating-5d87d4c76-btpfqand a client pod is namedr70eaa1a0f2-analytics-client-68c499d5f9-7g7vm:
- Verify that you have both the
.kibanaand.kibana-6indexes by running the following command:kubectl exec -it analytics-storage-coordinating-pod -- curl_es /_cat/indices?vIn the
indexcolumn of the response, look for.kibanaand.kibana-6:
If the response includes both indexes, it indicates a problem with the index creation. Proceed to the next step.
Note: If you received theUh oh! An error has occurred
page and the response to this command only includes the.kibana-6index, then something else is wrong with the cluster and you should contact IBM Support for assistance. - Set the
.kibanaindex to be read-and-write enabled by running the following command, replacinganalytics-storage-coordinating-podwith the name of the storage-coordinating pod that you determined at the beginning of this task:kubectl exec -it analytics-storage-coordinating-pod -- curl_es -XPUT .kibana/_settings -d '{"index.blocks.write":false}'When you see the following response: {"acknowledged":true}, continue to the next step.
Note: If you see a different response, make sure the request was correct and try again. If the command still does not work, then something else is wrong with the cluster and you should contact IBM Support for assistance. - Delete the
.kibana-6index by running the following command:kubectl exec -it analytics-storage-coordinating-pod -- curl_es -XDELETE .kibana-6When you see the following response: {"acknowledged":true} to indicate that the deletion was successful, continue to the next step.
Note: If you see a different response, then the index was not deleted. Make sure the request was correct and try again. If the delete operation still fails, then something else is wrong with the cluster and you should contact IBM Support for assistance. - Restart a single analytics client pod by running the following command and replacing
analytics-client-podwith the name of the pod (which you determined at the beginning of this task):kubectl delete pod analytics-client-podSample response: pod "analytics-client-pod" deleted
Wait for the response to ensure that the pod was successfully deleted. Then wait a few minutes for a new pod to start automatically. To check the status of the pods, run the following command:kubectl get pods - Navigate to the Analytics page and refresh to verify that the dashboard now displays correctly.
- (Optional) If you have a backup of
uior.kibana-6, you can restore it now as explained in Restoring the Analytics database.